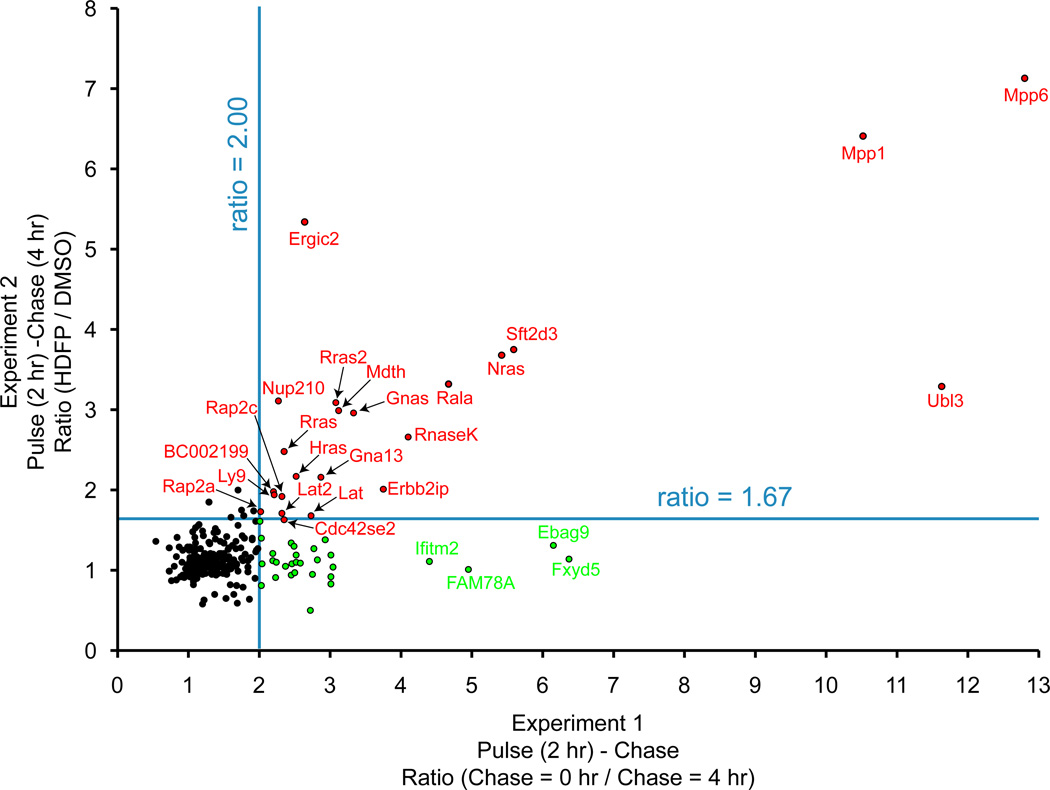
Figure 3.
Pulse-chase proteomic analysis of dynamic palmitoylation. In experiment 1 (x-axis), SILAC cell pairs were labeled with 17-ODYA for 2 hours, then harvested or chased with 10-fold excess palmitic acid for 4 hours. This experiment highlights proteins with rapid de-palmitoylation or protein turnover. In experiment 2 (y-axis), SILAC cell pairs were labeled with 17-ODYA for 2 hours, and chased with excess palmitic acid with or without the lipase inhibitor HDFP. This experiment highlights palmitoylated proteins where probe labeling is stabilized by lipase inhibition. Blue lines are arbitrary thresholds. Red dots are enzymatically regulated proteins with rapid turnover kinetics. Green dots are proteins with enhanced degradation, as determined by unenriched SILAC proteomics experiments. Adapted with permission from [24]. Copyright (2012) Nature Publishing Group.

