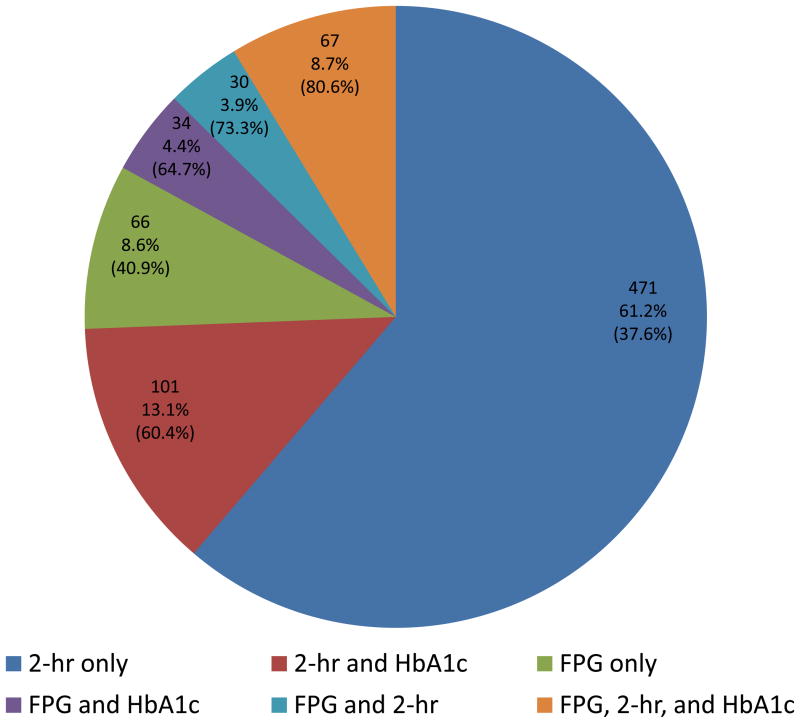
Figure 3.
Pie chart of the number (proportion) of individuals triggering a confirmation visit based on 2-hr glucose ≥200 mg/dl and/or FPG ≥126 mg/dl, further subdivided based on HbA1c ≥6.5%. Included in parenthesis is the proportion that was actually confirmed of having diabetes at the confirmation visit.

