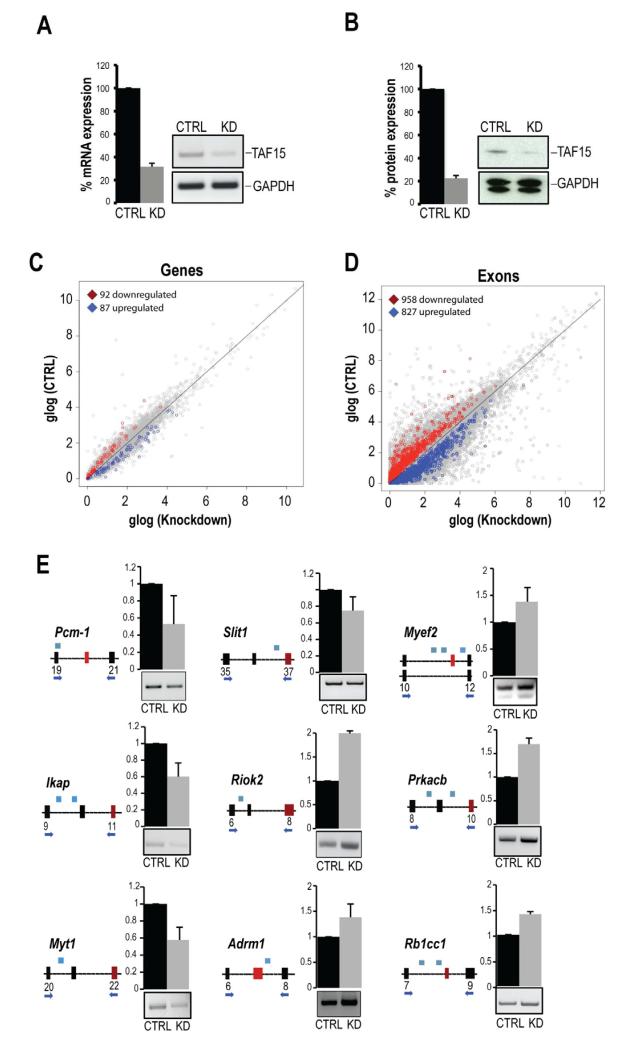
Figure 2. Impact of TAF15 knockdown on the transcriptome of mouse neurons.
A, B. TAF15 mRNA (A) and protein levels (B) after siRNA knockdown of TAF15 (KD), compared to control knockdown (CTRL), in mouse neurons. Quantitations (A, B) are shown as mean ± s.d., from three biological replicates; changes are significant (P<0.01).
C, D. Scatter plot of genes (C) and exons (D) expression calculated by RNA-Seq from 3 KD and 3 CTRL samples. Differentially expressed genes and exons (N=3; P<0.01) are highlighted, glog; generalized logarithm base 2.
E. RT-PCR validations of differentially included exons in mRNAs whose levels did not change upon TAF15 knockdown. Shown are schematics (constitutive exon: black box; differentially included exon: red box; intron: black line) with primers (arrows) and position of TAF15-peaks (blue boxes). Quantitation (error bars; s.d) and representative gels from RT-PCRs are shown. All detected changes are significant (P<0.01).
See also Figures S2 and S3.

