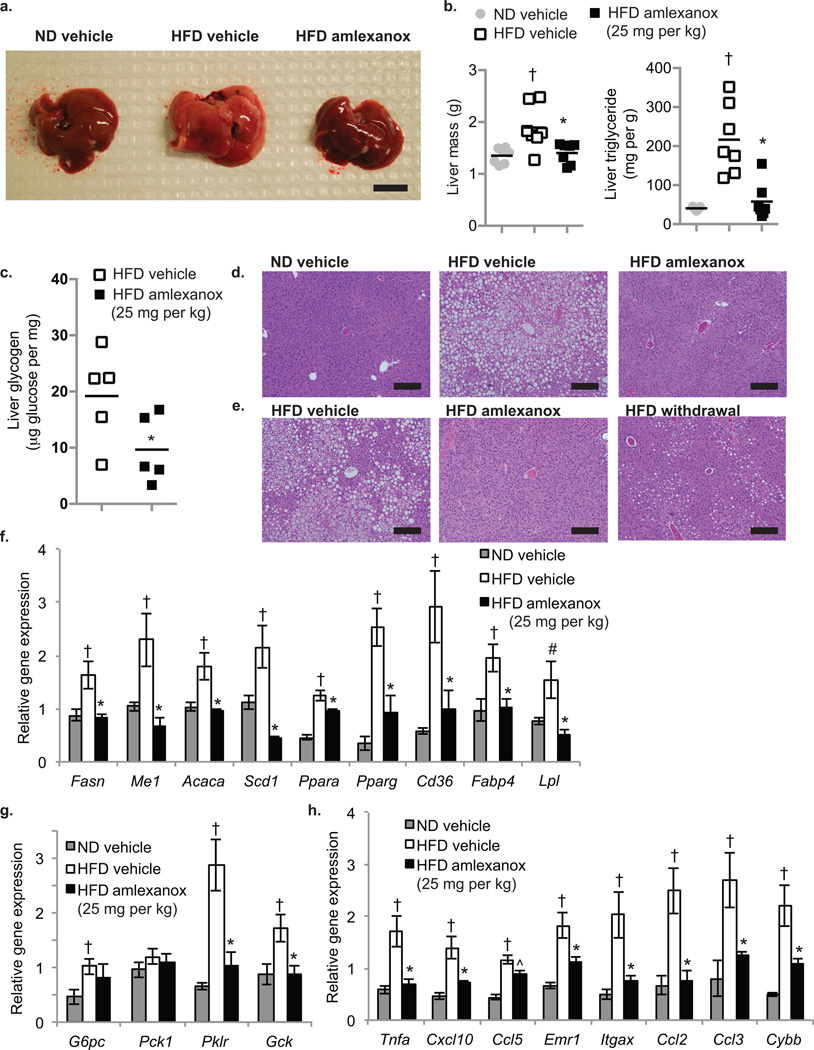
Figure 5. Amlexanox treatment reverses hepatic steatosis.
(a) Macroscopic pictures of the liver; left: ND vehicle control, middle: HFD vehicle control; right: HFD gavaged daily with amlexanox (scale bar = 1 cm). (b) Total liver weight (left panel) and triglyceride content (right panel) of mice on ND (grey bars) or HFD gavaged with vehicle (white bars) or amlexanox (black bars). (n=6 per group). (c) Liver glycogen content in HFD mice treated with amlexanox (black bars) or vehicle (white bars). (n=5 per group). (d,e) Representative images of hematoxylin and eosin (H and E)-stained liver (scale bars = 2 mm). (d) left: ND vehicle control, middle: HFD vehicle control; right: HFD treated with amlexanox. (e) left: HFD vehicle control, middle: HFD treated with amlexanox; right: HFD amlexanox withdrawal for ten weeks after eight weeks treatment. Expression of (f) lipid metabolism genes, (g) glucose metabolism genes, and (h) inflammatory genes and macrophage markers in livers of mice in treatment group. (f–h) Grey bars: ND vehicle control, white bars: HFD vehicle control; black bars: HFD gavaged daily with amlexanox (n=6 per group). All amlexanox treatment are daily gavage. * P value < 0.05 HFD vehicle control versus HFD amlexanox treated; † P value < 0.05 ND vehicle control versus HFD vehicle control; # P value < 0.1 ND vehicle control versus HFD vehicle control.

