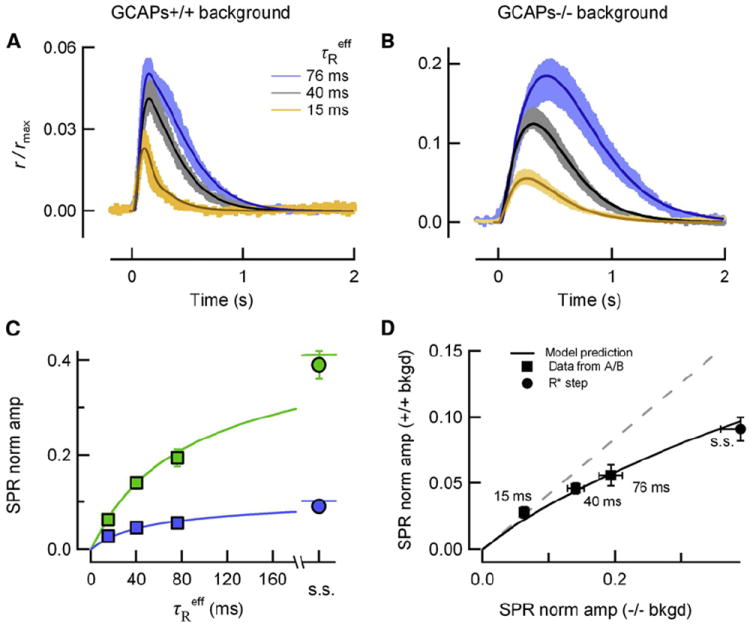
Figure 4. A Spatiotemporal Model of Phototransduction Captures the Enhanced Amplitude Stability in the Presence of GCAPs-Mediated Feedback.

(A) Simulated SPRs (thin traces) closely match the SPR (means +/− SEM, thick traces) experimentally determined from populations of wild-type (black/gray), Grk1+/− (blue), and Grk1S561L (orange) SPRs with feedback (A, GCAPs+/+ background) and without feedback (B, GCAPs−/− background). Parameters were optimized individually for each simulated response within 10% of the canonical values in Table 2.
(C) Normalized mean SPR peak amplitudes (r/rmax at the time of the peak in A and B) are plotted against τReff for GCAPs+/+ and GCAPs−/− backgrounds (blue and green boxes, respectively). Mean steady state (s.s.) amplitudes of SPRs arising from R*s that do not deactivate are plotted for both genetic backgrounds (blue circle corresponds to SPR amplitude of Grk1−/− (Song et al., 2009 supplement); green circle corresponds to amplitude of GCAPs−/− “rogues” (Gross et al., 2012). Theoretical green and blue traces were simulated using the parameters in Table 2. Error bars reflect S.E.M. (error bars are smaller than the points in most cases).
(D) GCAPs-mediated feedback more strongly attenuates SPRs arising from long-lived R*s. GCAPs+/+ and GCAPs−/− SPR amplitude data from (C) are plotted against each other (black squares; numbers indicate τReff), as are the corresponding theory traces (black trace). The dashed gray line is the relationship that would be expected if rods in GCAPs+/+ and GCAPs−/− backgrounds exhibited the same degree of stability. Error bars reflect S.E.M.
