
Figure 5. The Rate of cGMP Synthesis Increases More Rapidly for Longer R* Lifetimes, Constraining the Time to Peak and Conferring SPR Amplitude Stability.
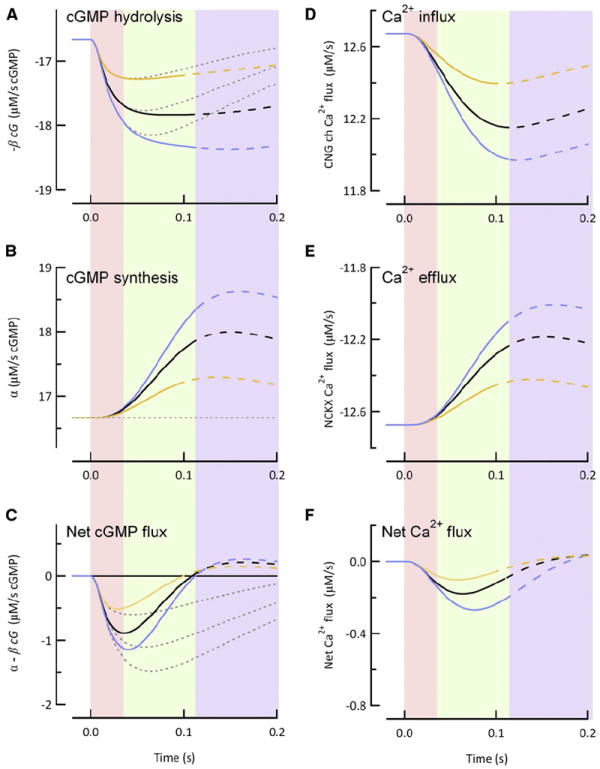
(A) Time course of the spatially integrated cGMP hydrolysis rate calculated for mean effective R* lifetimes of 15 ms (orange curve), 40 ms (black curve), and 76 ms (blue curve) with (solid traces) or without (gray dotted lines) GCAPs-mediated feedback.
(B) Spatially integrated cGMP synthesis rates for the R* lifetimes listed in (A). Thin dotted black line indicates the constant (dark) rate of cGMP synthesis in the absence of GCAPs-mediated feedback. Note that the larger G*-E* activities in (A) correspond to steeper rates of change in the cGMP synthesis rates.
(C) Spatially integrated rate of change of cGMP concentration (differences of the time courses in A and B).
(D) Calculated influx of calcium through CNG channels and (E) calculated efflux of calcium via Na2+/Ca2+-K+ transporter for the same effective R* lifetimes of (A)–(C) in the presence of GCAPs-mediated feedback.
(F) Time course of net calcium flux (differences of the time courses in D and E). In all panels, the solid curves transition to dashed curves at times corresponding to the peak of the SPRs. Shaded regions indicate distinct epochs during the SPR: Pink: cGMP synthesis remains near its dark level; green: rate of cGMP synthesis increases as a ramp with slope proportional to the constant cGMP hydrolysis rate, so that synthesis and hydrolysis cancel each other at the SPR peak; blue: SPR recovery phase.