Figure 1.

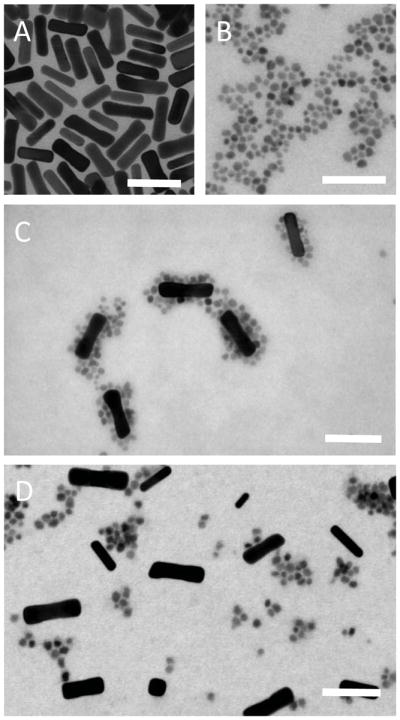
TEM images of (A) COOH-AuNRs, (B) TREG-SPIONs, (C) a reaction mixture of COOH-AuNRs and TREG-SPIONs showing SPION-AuNR formation, and (D) a reaction mixture of mPEG-AuNRs and TREG-SPIONs. The scale bar in each image represents 50 nm.

TEM images of (A) COOH-AuNRs, (B) TREG-SPIONs, (C) a reaction mixture of COOH-AuNRs and TREG-SPIONs showing SPION-AuNR formation, and (D) a reaction mixture of mPEG-AuNRs and TREG-SPIONs. The scale bar in each image represents 50 nm.