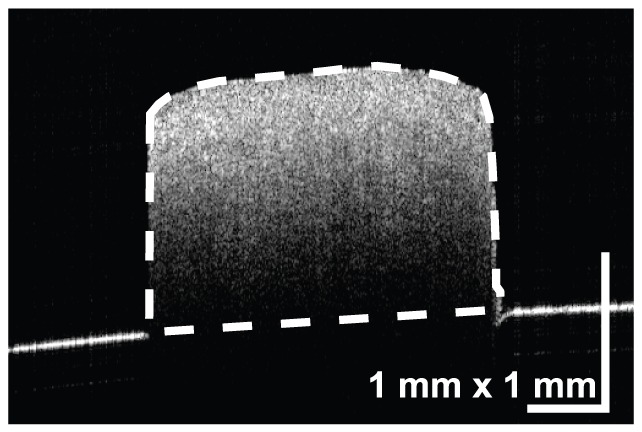
Figure 3. An OCT image with a rubber plate used for the measurement of the cross-sectional area.

The area between the sample surface and the surface of the rubber plate behind the sclera, which is defined by line interpolation from the exposed surface of the rubber plate, was defined as the cross-sectional area.
