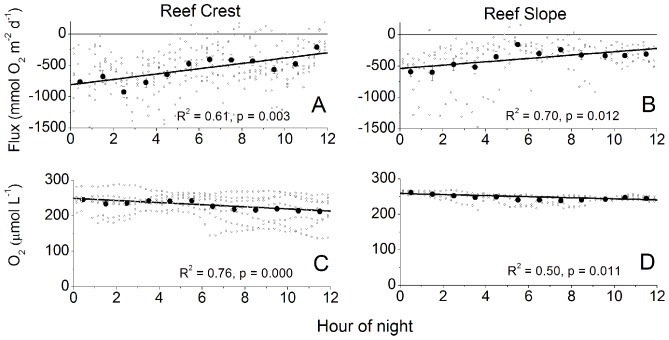
Figure 7. The large decrease in R but small decrease of O2 across the night.
Figure A and B show the decrease in R across the night of approximately 60% at both sites. Figure C and D show a 5 to 15% decrease in the O2 concentration across the night which cannot explain the decrease in respiration. The solid circles represent averages over 1 h and the error bars are ±SE with the lines fit to binned data. Correlations applied to hourly binned data (± SE), with the small open circles representing the 0.25 h fluxes.

