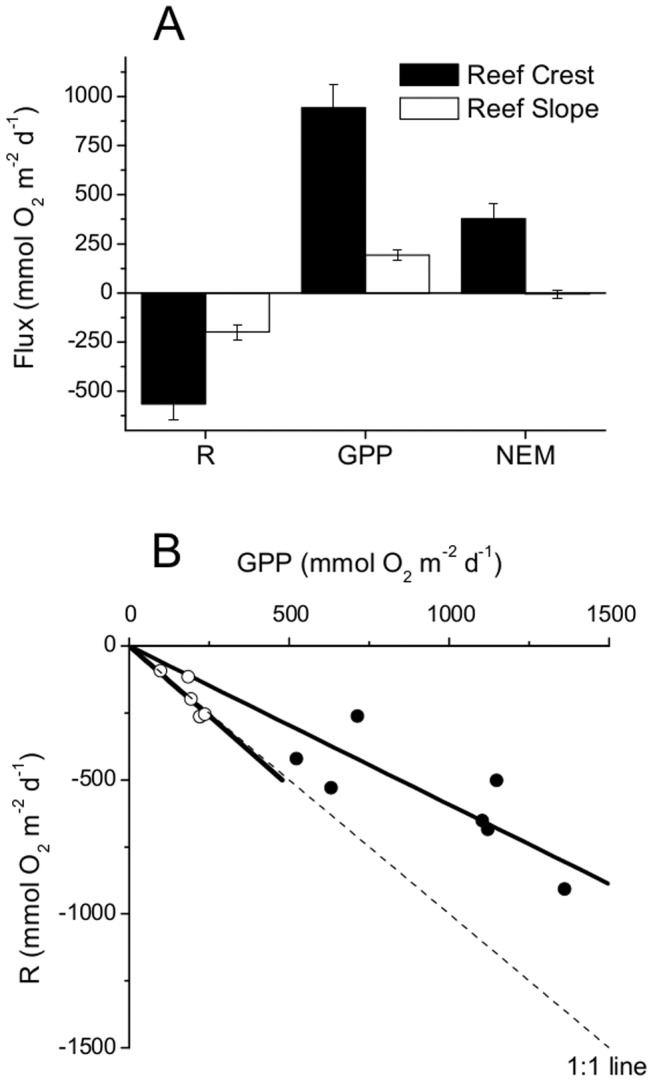
Figure 8. The average respiration, gross primary production, and net ecosystem metabolism at each site.

The average respiration, gross primary production and net ecosystem metabolism rates across 24 h periods for the RC site (n = 7) and the RS site (n = 5) in Fig A. The n is the number of 24 h periods and the error bars are ±SE. The relationship between the net production and the nightly respiration over each 24 h period are shown in Figure B. The solid circles are the RC site and the open circles are the RS site.
