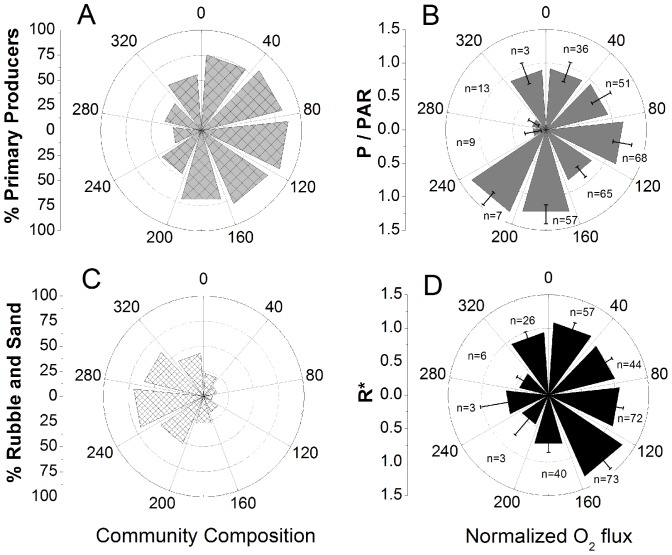
Figure 9. The flux as a function of direction and how it relates to the community composition.
Panel A and C show the RC percent coverage of primary producers and percent rubble and sand in each direction, respectively, with the highest percentages of rubble and sand coincident with the lowest fluxes (as well as the lowest n). A directional plot showing the RC flux during the day divided by the PAR level is shown in panel B. Similarly, a directional plot of the RC flux during the night is shown in panel D, where R* is the instantaneous flux divided by the average flux. The n is the number of 0.25 h measuring periods in each direction and error bars are ±SE.

