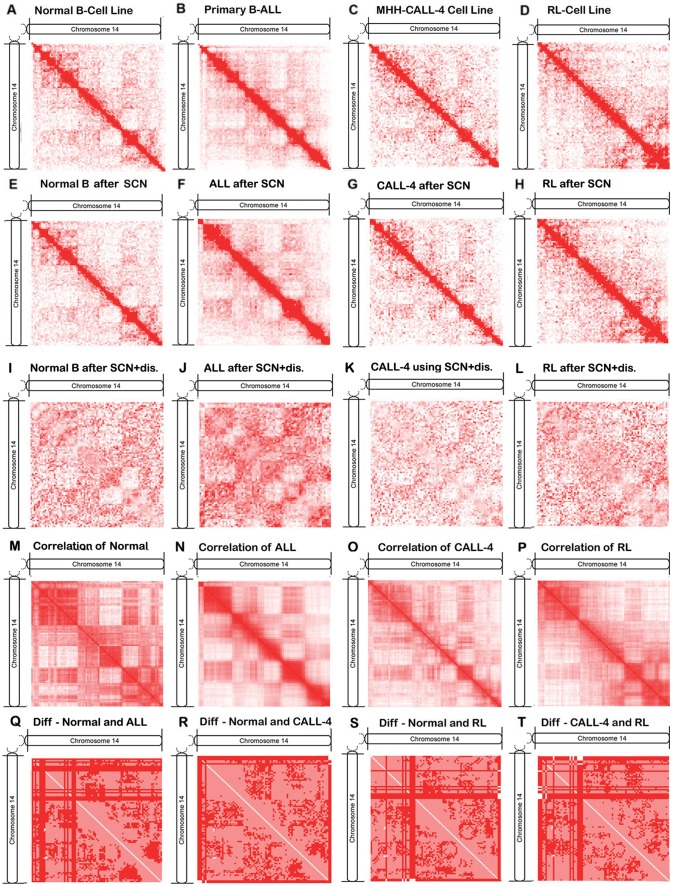
Figure 2. The contact matrices, correlation matrices, and difference matrices of chromosome 14 after applying normalization.
(A–D) denote the contact matrices after removing reads mapped to multiple locations on the genome, (E-H) the contact matrices after applying SCN normalization method to the maps in (A–D), (I–L) the contact matrices after applying both genomic sequential distance based method and SCN to maps in (A–D), (M–P) the correlation matrices based on maps in E-H, and (Q–T) the difference matrices of between correlation matrices in M-P of normal and malignant samples.

