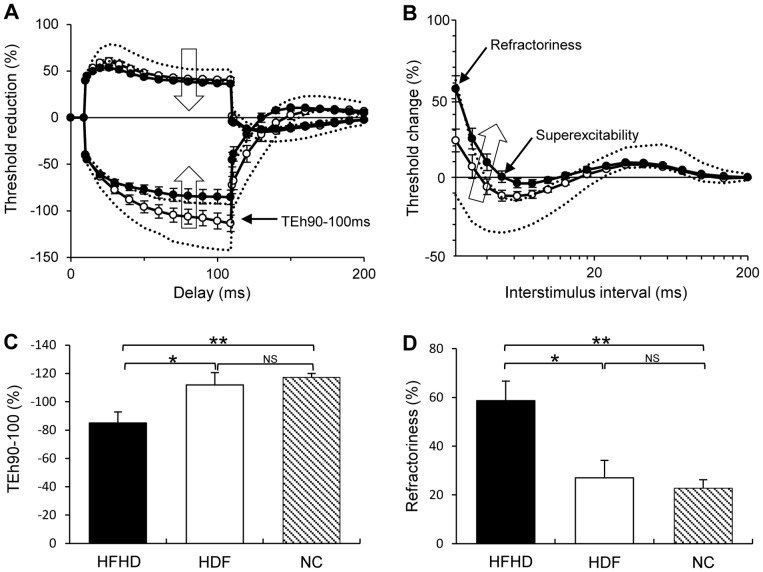
Figure 1. Pre-RRT nerve excitability recordings.
Patients receiving hemodiafiltration (HDF) (empty circles) and standard high-flux HD (black filled circles) compared to 95% limits for healthy controls (dashed lines). (A) Depolarising and hyperpolarising threshold electrotonus curves. (B) Recovery cycle curve of excitability, large empty arrows indicate the direction of change with axonal depolarization. In both figures (A) and (B) the HDF group demonstrate results significantly closer to normal values than the HFHD group, specifically at hyperpolarising threshold electrotonus 90–100 ms (TEh90–100 ms), refractoriness and superexcitability. Figures (C) and (D) demonstrate the group differences in TEh90–100 ms and refractoriness in histogram format. *p<0.05, **p<0.001.

