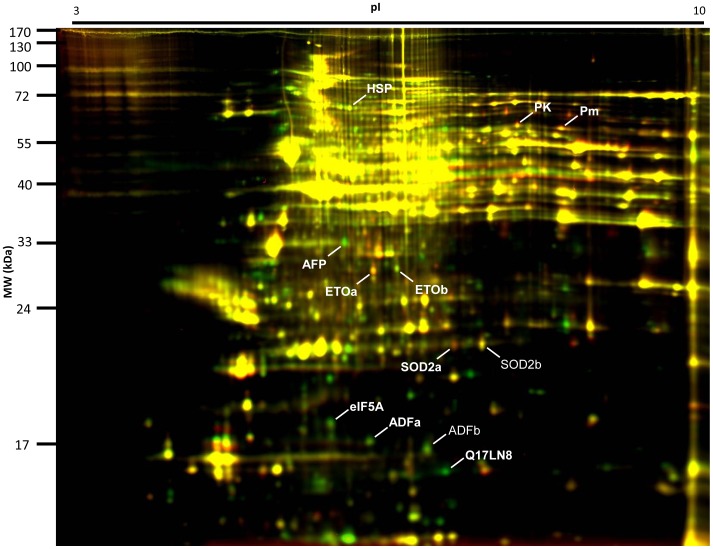
Figure 1. Differential proteome expression between two Ae. aegypti age samples (1 and 34 d old) compared using the 2-D DIGE procedure.
Spots indicate individual proteins separated in one dimension according to the isoelectric point in an orthogonal dimension according to molecular mass. Spots appearing red represent proteins that are more highly expressed in the 34 d sample than the 1 d sample, whereas spots appearing green are more highly expressed in the 1 d sample. Yellow spots represent proteins that are equally abundant in the two age samples. Labeled spots indicate age-dependent proteins (bold) and related isoforms described in the text. Data supporting the identities shown and the identities of 86 other prominent spots are provided in Figure S4 and Table S3.

