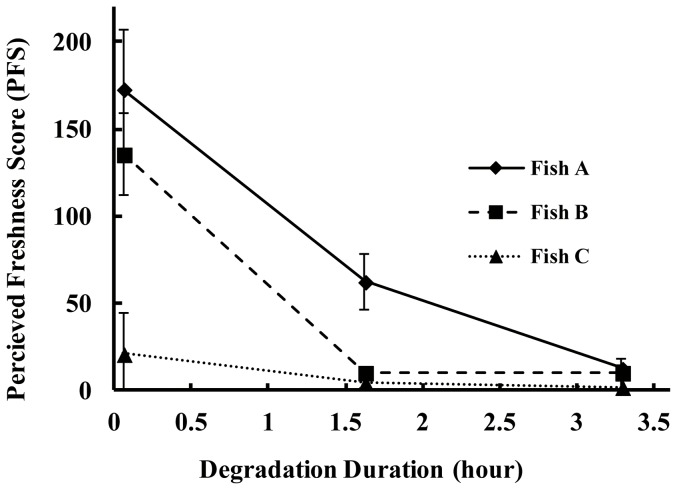
Figure 3. Perceived freshness score (PFS) in each stimulus image as a function of degradation time.
The x-axis indicates the degradation time (hour) and the y-axis indicates PFS. Each line represents a function of degradation time of each individual fish. The vertical bars indicate standard error (SE).

