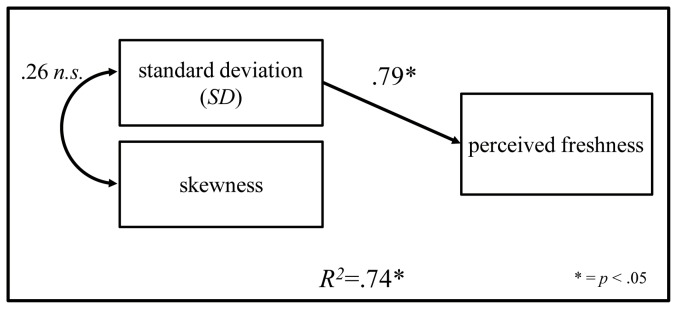
Figure 4. The regression model, which is most appropriate for accounting for PFS computed by multiple linear regression analysis.

Two luminance distribution dimensions (standard deviation and skewness) have a significant influence on PFS (R2 = .74, F = 8.43, p<.05). Only standard deviation significantly and positively influenced PFS (beta = .79, p<.05).
