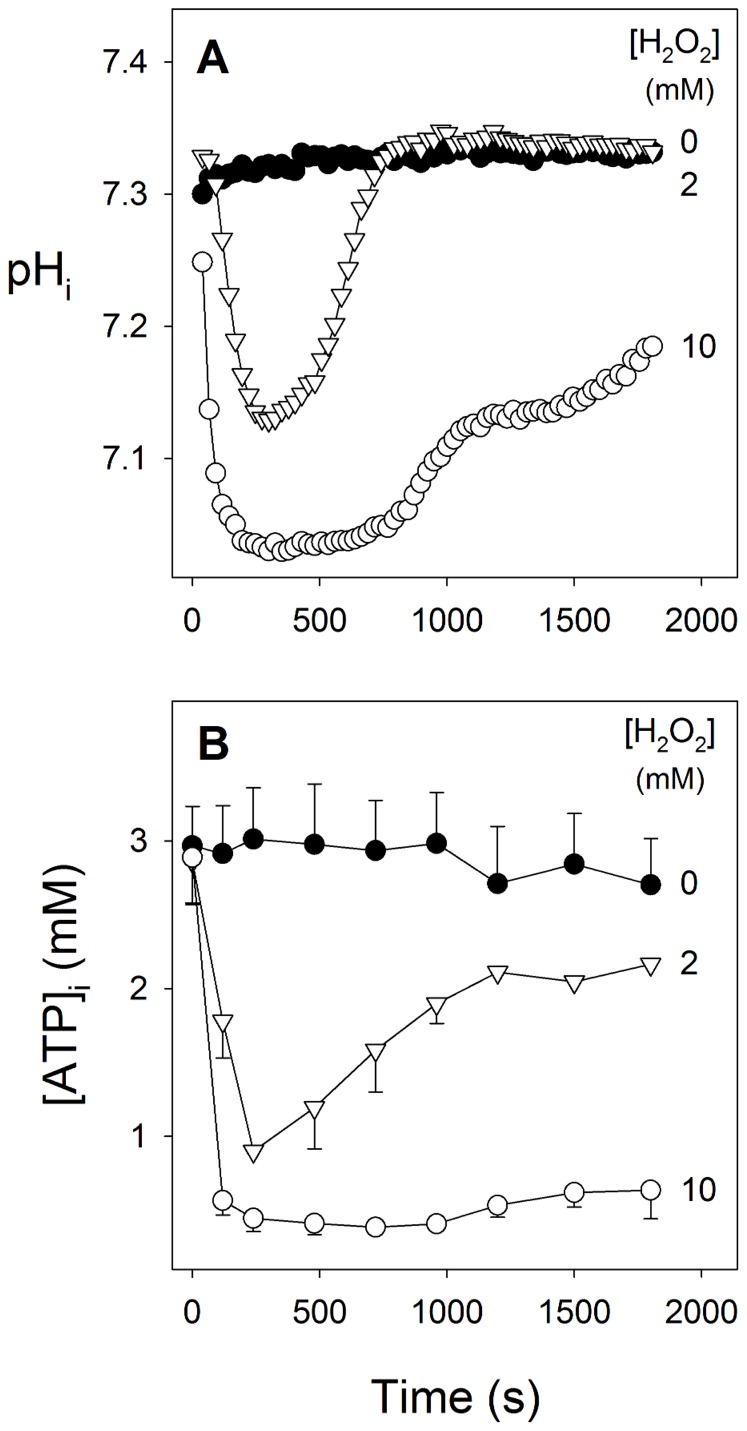
Figure 2. Concentration-dependent effects of H2O2 on (A) cytosolic pH (pHi) and (B) [ATP]I in isolated parasites.
Isolated 3D7 P. falciparum trophozoites were loaded with the pH-sensitive fluorescent dye BCECF. H2O2 was either absent (black circles) or added at time-zero at a concentration of either 2 mM (triangles) or 10 mM (open circles). The data are averaged from three separate experiments. In (A) the error bars were omitted for clarity; in the control experiment the S.E.M. ranged from 0.003–0.013 pH units, in the 2 mM H2O2 experiment the S.E.M. ranged from 0.003–0.092 pH units, and in the 10 mM H2O2 experiment the S.E.M. ranged from 0.008–0.109 pH units. In (B) the error bars denote S.E.M.

