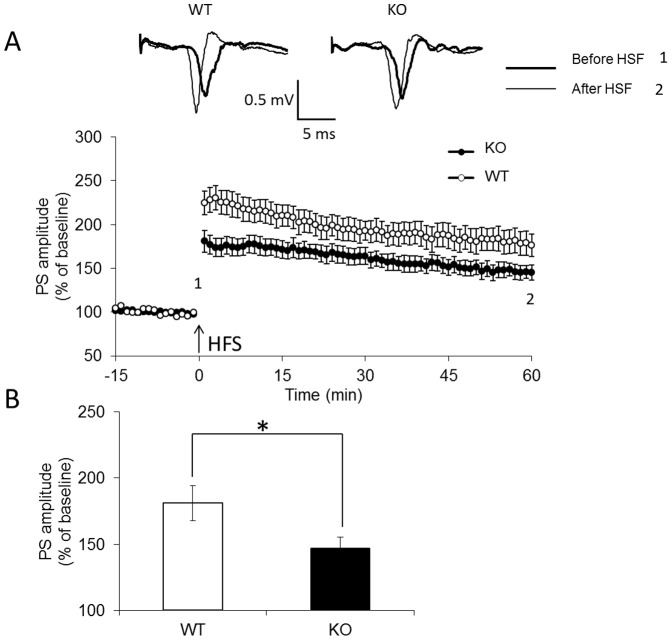
Figure 6. LTP was significantly reduced in fmr1 KO zebrafish.
(A) The arrow indicates delivery of HFS. Insets are representative, superimposed, single sweeps before and after LTP induction in wild-type (n = 9) and fmr1 KO (n = 10) zebrafish. (B) Summary of the averaged magnitudes of LTP. Bars correspond to the percentages of baseline PS amplitudes during the last 10 min. *p<0.05 compared with wild-type.

