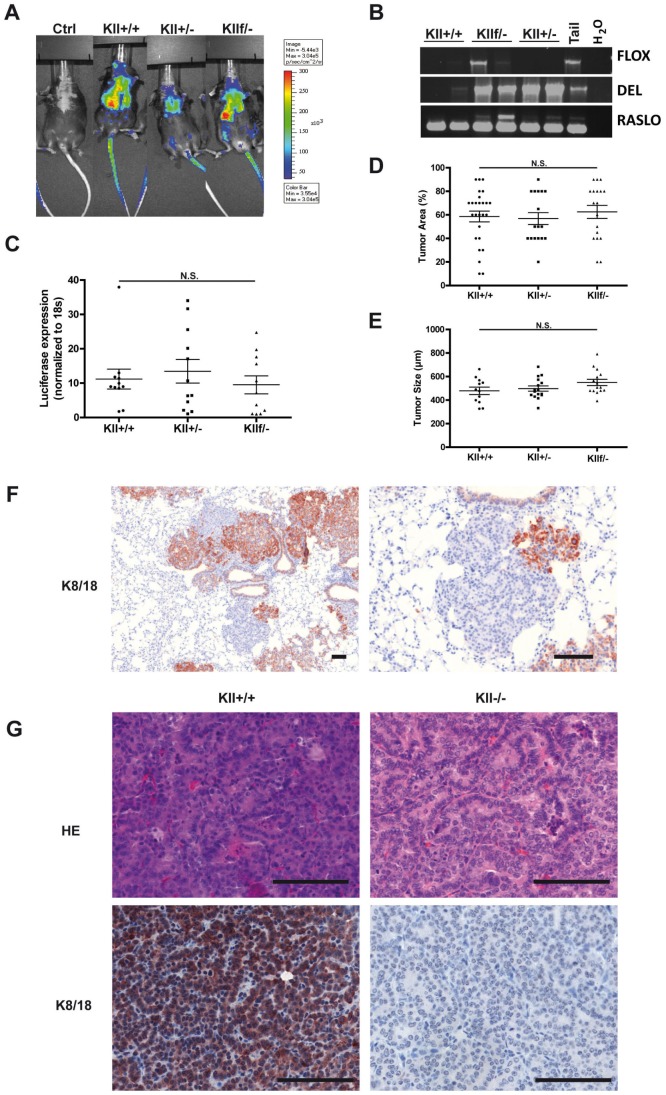
Figure 3. Tumors with In vivo inactivation of the Keratin type I cluster show no significant alteration in tumor biology.
(A) Groups of RASLO transgenic mice crossed onto different Keratin II cluster alleles were anesthetized with Ketamine/Rompun, and 2×10∧7 pfu AdCre were administered i.n. six week previously. For tumor detection, mice were injected i.p. with luciferin in 200 µl PBS and imaged with an IVIS-200 (Xenogen) camera. Bioluminescense comparing representative wild-type (ctrl), RASLO transgenic with wild-type Keratin locus (KII +/+), RASLO transgenic with heterozygous Keratin cluster II expression (KII +/−) and RASLO transgenic mice with one knock-out and one floxed Keratin cluster II allele (KII f/−) are shown here. The different groups showed bioluminescence signals with comparable intensity. (B) Allele specific PCR analyses for DNA isolated from cryo-conserved lung tumors of RASLO mice for detecting the FLOX, DEL, and RASLO alleles were performed. (C) Luciferase mRNA expression level were determined in cryo-conserved lungs by qRT-PCR to estimate the tumor load. Expression level was normalized to 18 s RNA. (D) Quantification of tumor burden by area on three sections per lung. Three representative HE sections per lung were analyzed with respect to percentage of tumor area (upper panel) and tumor size (lower panel). FFPE sections were stained for K8/18 and imaged with Pannoramic250 (3DHistech) slide scanner. Maximal tumor diameter of up to thirty tumors representative tumor per slide was measured with the 3DHistech Pannoramic Viewer and the mean maximal diameter compare between the different genotypes. (F) Immunohistochemical staining for keratins 8 and 18 in tumors of RASLO KII f/− mice. (G). The scale bar represents 100 µm. Wild type RASLO tumors (left) compared to KII−/− tumors on the right are shown as HE stains (upper panels) and Keratin 8 and 18 (lower panels) values are depicted as mean +/− SEM. Statistical significance was calculated using a Student’s t-test: *p≤ 0.05, **p≤0.01, ***p≤0.001. Representative of three independent experiments.

