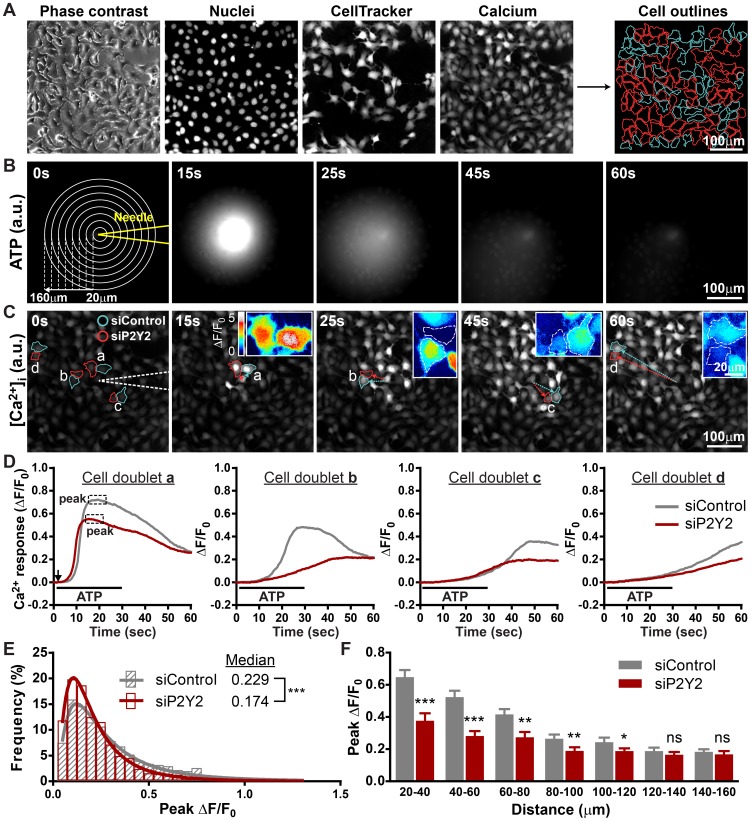
Figure 4. Knocking down P2Y2 expression attenuates the ATP-mediated [Ca2+]i increase.
(A) Fluorescence images showing how software-assisted cell demarcation and population identification is performed according to DNA and cell tracer dye staining. Cyan lines define control cells, and red lines outline P2Y2-deficient cells. (B) Time series of fluorescence imaging of Alexa Fluor-647 ATP released from microinjection needle. Concentric circles define the radial distances from needle tip in 20 µm steps (a.u., arbitrary unit). (C) Time series of fluorescence imaging of calcium wave spreading in a co-culture monolayer containing an equal ratio of control and P2Y2-deficient HaCaT cells. Four representative cell doublets with various distances from the needle are outlined in cyan and red. White dotted lines outline the position of glass needle. Insets: enlarged pseudo-color images of control and P2Y2-deficient cell doublets depicted in ΔF/F0. Dotted lines depict the cell outline (a.u., arbitrary unit). (D) Traces showing Ca2+ change (fold change from baseline, ΔF/F0) in cell doublets from panel C. The black arrow indicates the initiation of ATP point release, and the black line defines the duration of ATP point release. (E) Frequency distribution and log Gaussian fit comparing the peak Ca2+ change between control (gray) and P2Y2-deficient (red) cells. (832 vs. 953 cells pooled from 12 calcium waves, Mann-Whitney test was used to determine statistical significance). (F) Bar graph comparing the average of median peak [Ca2+]i response between control and P2Y2-deficient cells within the same range relative to the needle tip (mean±SEM, n = 12 calcium waves, Student's t test, * p<0.05; ** p<0.01; *** p<0.001; ns = not significant).

