
Figure 1. Heat map showing the correlation of the change in a subset of metabolite concentrations with each other.
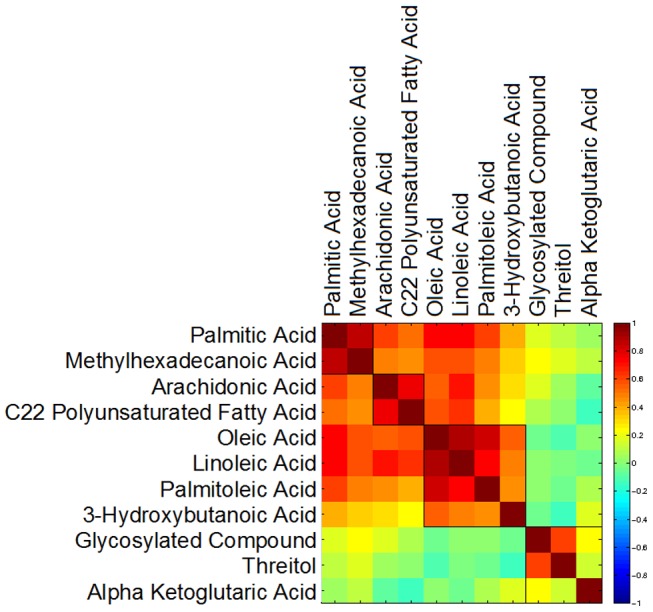
The fatty acids correlate with each other but not with threitol or alpha-ketoglutaric acid.
Official websites use .gov
A
.gov website belongs to an official
government organization in the United States.
Secure .gov websites use HTTPS
A lock (
) or https:// means you've safely
connected to the .gov website. Share sensitive
information only on official, secure websites.
The fatty acids correlate with each other but not with threitol or alpha-ketoglutaric acid.