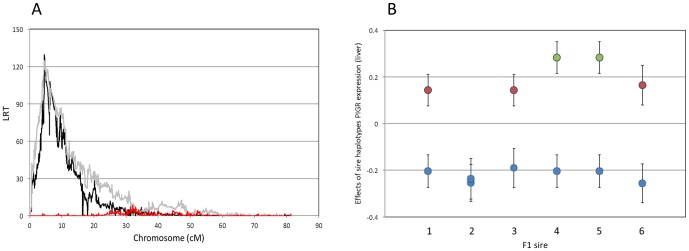
Figure 3. Chromosome 16 eQTL for PIGR mRNA expression.

(A) Location scores (LRT = likelihood ratio test) obtained when scanning bovine chromosome 16 for QTL influencing PIGR transcript levels (black line) in liver using a mixed-model based approach that simultaneously extracts linkage and LD information. The red curve corresponds to the location scores obtained for PIGR mRNA expression level (liver) when adding the effect of PIGR haplotype (I, II and III; cfr. Fig. 4) in the model. The gray line corresponds to the location score obtained for IgA yield of the 8th colostrum (cfr. Fig. 1A). (B) Effect (± SEM) of the haplotypes of the six F1 sires on PIGR expression level in liver. The haplotypes are labeled according to their corresponding PIGR genotype (I: blue; II: green; III: red; cfr. Fig. 4).
