
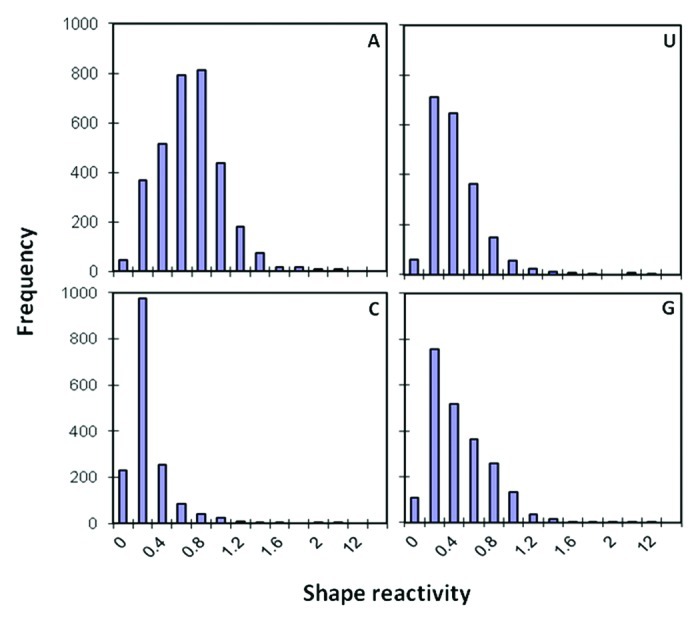
Figure 2. SHAPE reactivity of each nucleotide (A, U, C and G) in HIV-1 NL4-3 RNA. The histograms show increasing SHAPE reactivity in windows of 0.2 (X-axis, relative units). Frequency refers to the number of nucleotides per SHAPE window. Note the deviant SHAPE reactivity of the A-nucleotide.