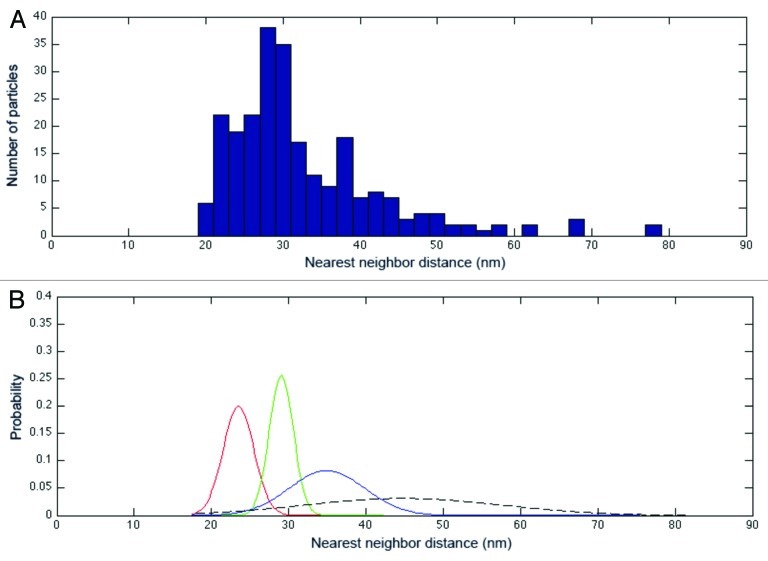
Figure 3. Clustering of nearest-neighbor center-to-center distances. (A) Distribution of nearest-neighbor center-to-center distances between all ribosome particles in the data set (n = 248) (For statistical relevance, the data from the two tomograms presented in Fig. 1 were merged). (B) Normal probability density functions corresponding to the data set in (A) (μ, average; σ, standard deviation). The analysis underlines the presence of two main populations (red and green lines) corresponding to ribosomes in close contact, as well as two minor ones (blue and dotted lines) corresponding to isolated particles.

An official website of the United States government
Here's how you know
Official websites use .gov
A
.gov website belongs to an official
government organization in the United States.
Secure .gov websites use HTTPS
A lock (
) or https:// means you've safely
connected to the .gov website. Share sensitive
information only on official, secure websites.
