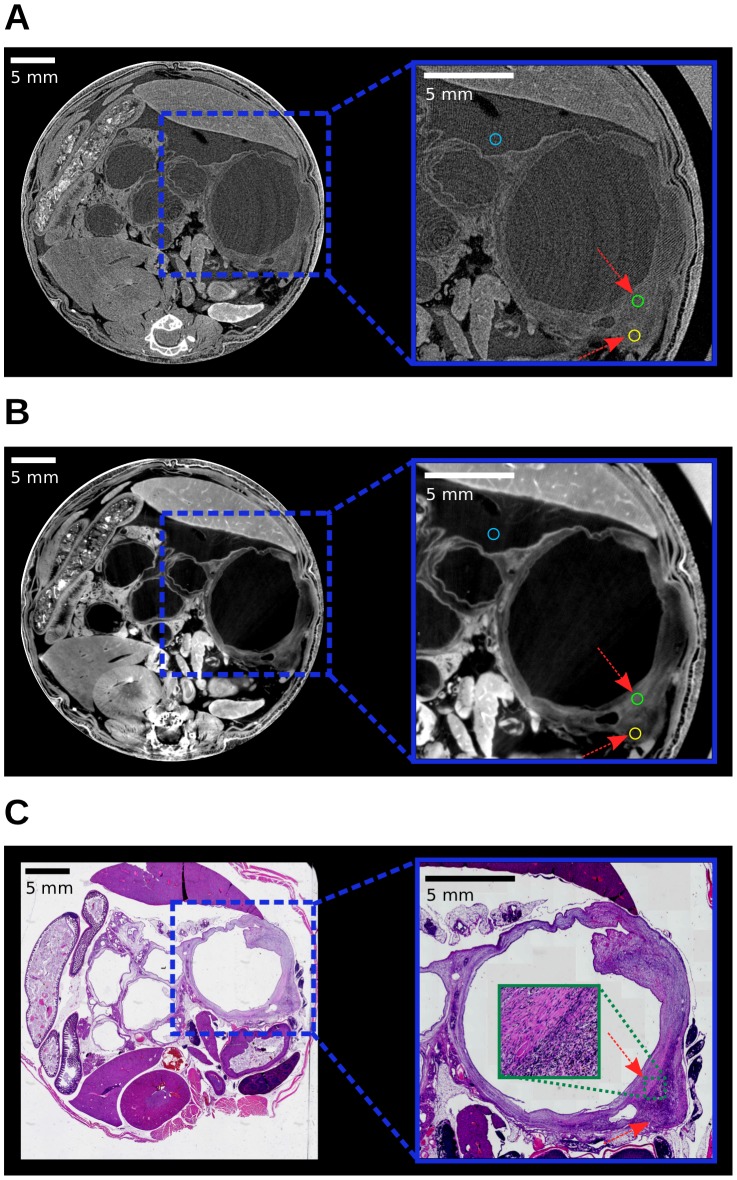
Figure 3. Assessment of tissue composition discernibility.
(A)  (left), Zoom (right). (B)
  (left), Zoom (right). The arrows highlight positions of differences in tissue composition. (C) Histology (left), Zoom (right). Regions-of-interest for the quantitative contrast-to-noise ratio analysis in the x-ray images are indicated by colored circles. All images are displayed on a linear gray scale and are windowed for best visual appearance of the cystic lesion.

