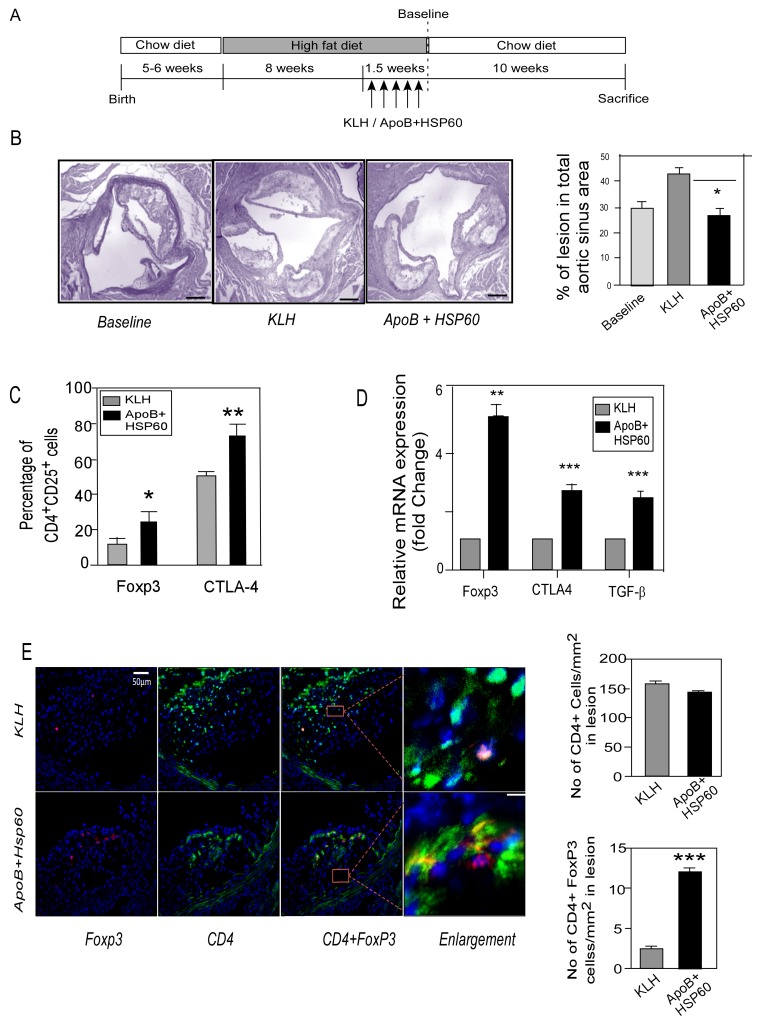
Figure 3. Oral Tolerance to ApoB+HSP60 peptides in Combination with Diet Modification Arrests Plaque Progression.
A. Experimental design. B. Representative photomicrographs of EVG stained plaque area and its quantitative analysis in aortic sinus of 26 week old ApoBtm25gyLDLrtm1Her mice (n = 10 per group) *P = 0.01 for APOB+HSP60 tolerized animals compared to KLH. Scale bar represents 200 µm. C. Percentage of CD25+Foxp3+ cells (*P = 0.011) and CTLA-4+cells (**P = 0.005) within the CD4 population in spleen (n = 6 per group). D. Expression of mRNA of Foxp3 (**P = 0.003), CTLA-4 (***P<0.001), and TGF-β (***P<0.002) in the ascending aorta were quantified by RT-PCR analysis and normalized to GAPDH. Fold-changes in their expression in ApoB+HSP60-tolerized mice relative to controls (n = 5 per group). E. Representative photomicrographs showing double immunofluorescence staining of aortic sinus sections with CD4 (green) and Foxp3 (red). Scale bar represents 50 µm. Enlarged region to show double immune staining. Scale bar represents 6.25 µm. Lower panel: Number of CD4-positive cells/mm2 and CD4+ Foxp3+ cells/mm2 (n = 9 per group), ***P<0.001.

