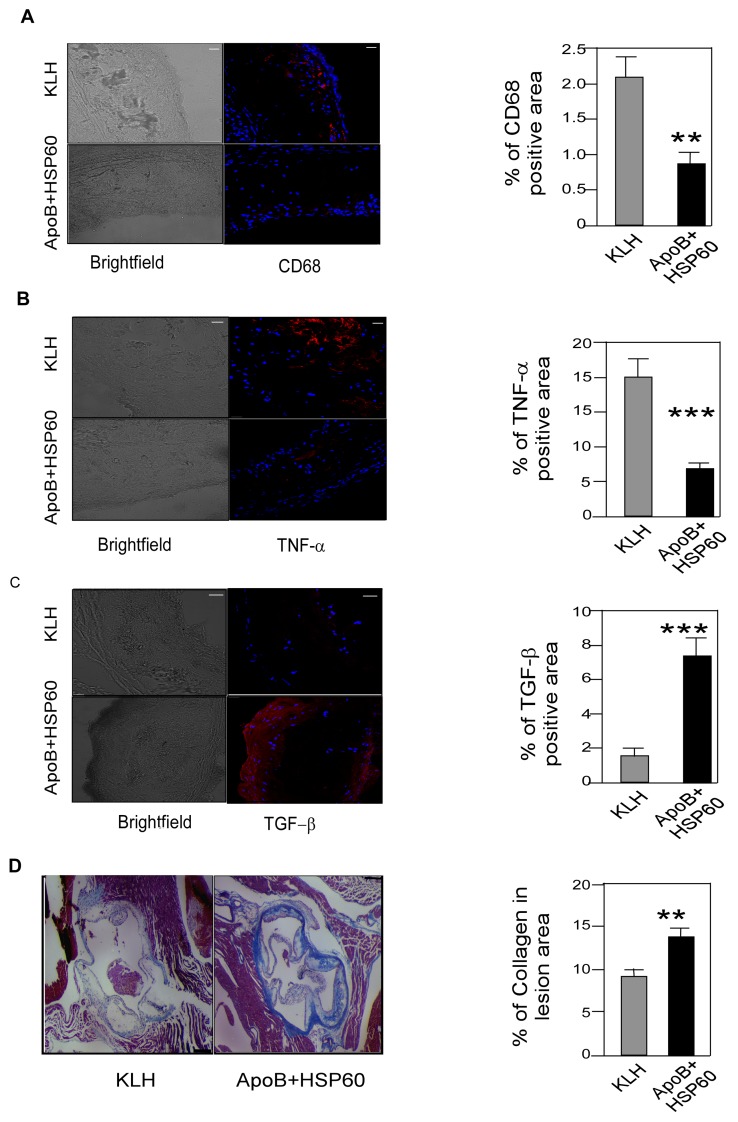
Figure 4. Shift in the Balance between Pro- and Anti-Inflammatory Markers in Association with Plaque Regression.
A. Representative photomicrographs showing immunofluorescence staining of aortic sinus sections with CD68 (red) and its quantitative analysis (n = 10 per group). **P = 0.025 B. Representative photomicrographs showing immunofluorescence staining of aortic sinus sections with TNF-α (red) and its quantitative analysis (n = 6 per group). ***P = 0.001 C. Representative photomicrographs showing immunofluorescence staining of aortic sinus sections with TGF-β (red) and its quantitative analysis (n = 6 per group). ***P = 0.003 D. Paraffin-embedded aortic sinus sections stained with Masson’s trichrome (light blue) and quantitative analysis of collagen in lesion area (n = 6 per group). **P = 0.008. Scale bar represents 200 µm. Scale bar represents 50 µm for the immunofluorescence staining.

