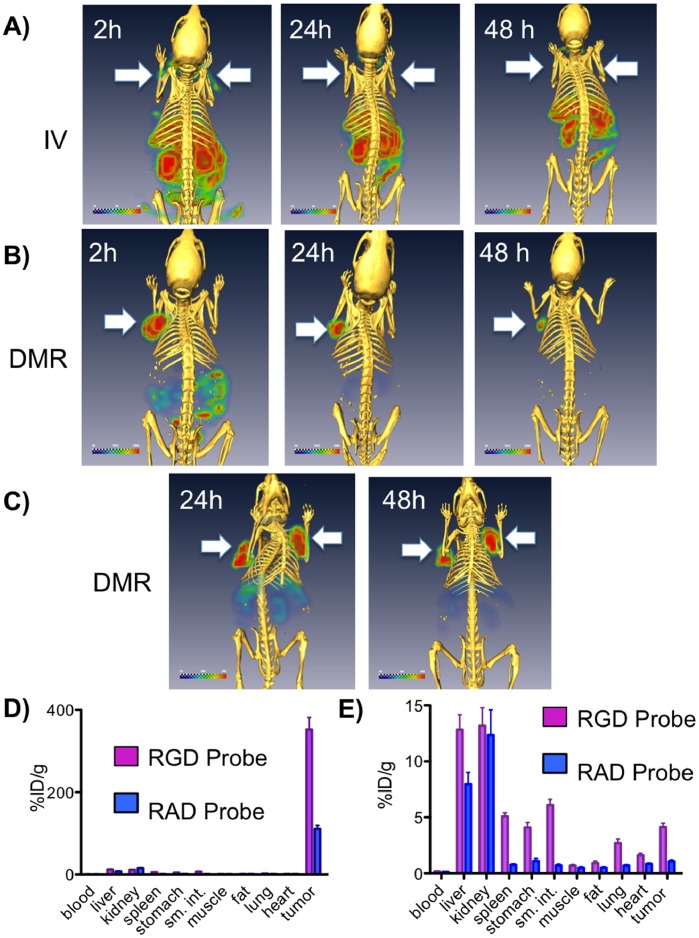
Figure 6. SPECT/CT images after PT and IV injections with the 111In RGD probe using the BT-20 tumor model.
SPECT images after injections (A–C) of the 111In-RGD probe by the IV or PT DMR methods are shown with one or two tumors/animal (arrows). Radioactivity is shown with a green to red color scale, while CT bone density is yellow. A) Tail vein IV injection. B) Single PT injection (DMR). C) Dual PT injections (DMR). Post dissection tissue radioactivity concentrations obtained with the 111In-RGD and 111In-RAD probes by IV injection (D) and PT injection (E) are shown. Radioactivity was 0.3 mCi per injection for IV and PT injections in this figure.

