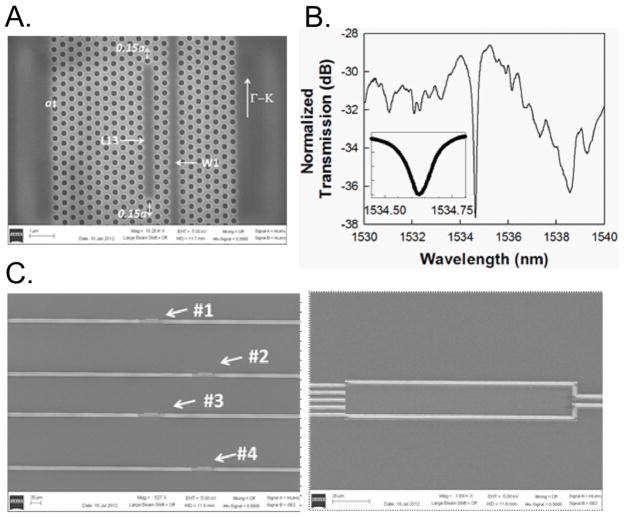
Fig. 1.
(A) Scanning electron micrograph (SEM) image showing L13 PC microcavity coupled to a W1 PC waveguide. (B) Fiber-to-fiber normalized experimental output transmission spectrum of W1 PCW in (A) showing band edge at 1538 nm and L13 PC microcavity resonance mode at 1534 nm. (inset) magnifies the resonance frequency range. (C) Multiplexed device showing the 1×4MMI (right) and the photonic crystal sensor regions (left) on each arm.

