
Fig. 5.
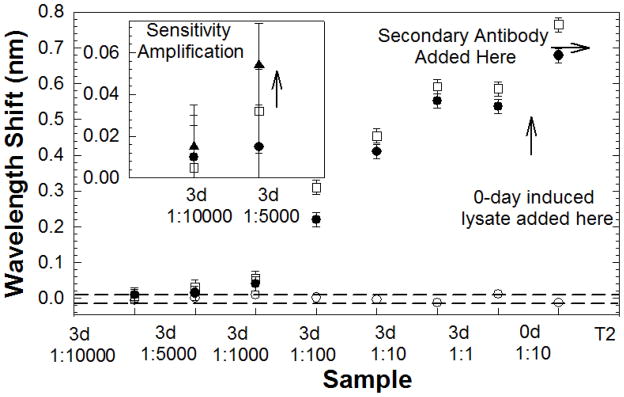
L13 PC microcavity resonance wavelength shift as a function of concentration with anti-ZEB1 primary probe capture (filled circles) and anti-MYC 9E10 primary probe capture (open squares) antibodies. The secondary antibody T2 is anti-MYC 9E10 and anti-ZEB1 respectively for data plotted with filled circles and open squares. Control BSA coated L13 PC microcavity resonance as a function of position is plotted with open circles. (inset) Sandwich assay experiment at lowest concentration enables binding specificity verification and sensitivity amplification. Secondary anti-ZEB1 induced resonance shift indicated by filled triangles.