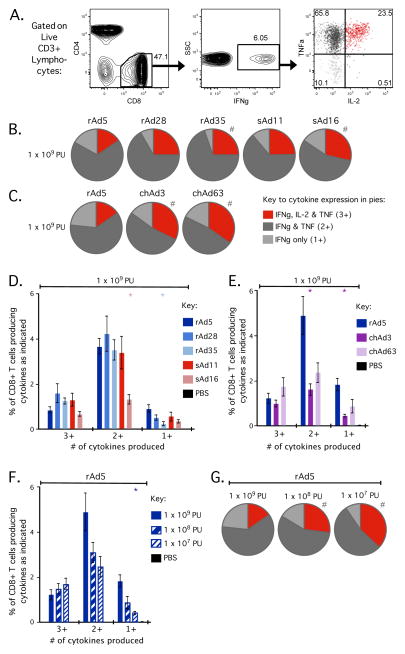
Figure 4.
Qualitative profiles of CD8+ T cells in the spleen 70 days (at memory) after rAd vaccination. C57BL/6 mice (n=4–5) were vaccinated with 1 × 10⁹, 1 × 10⁸ or 1 × 10⁷ PU of the indicated rAd vector expressing SIV Gag. Splenocytes were processed as in Figure 3 to determine Gag-specific production of IFNγ, TNFα and IL-2. Boolean gating was used to define subsets of CD8+ T cells expressing any possible combination of IFNγ, IL-2 and TNFα. (A) Representative flow cytometry plots after rAd5 vaccination to illustrate the populations of CD8+ T cells used for qualitative analysis. CD3+ lymphocytes were gated on CD8+ events (left plot), then IFNγ+ events (middle plot) prior to analysis of TNFα and IL-2 production (right plot). IFNγ-producing Gag-specific CD8+ T cells expressed IFNγ, TNFα and IL-2 (red), IFNγ and TNFα (dark grey) or IFNγ-alone (light grey), thereafter simplified as 3+, 2+ and 1+ cells, respectively. (B/C) The proportion of Gag-specific CD8+ T cells that are 3+, 2+ or 1+ after vaccination with 1 × 10⁹ PU of rAd5, rAd28, rAd35, sAd11 or sAd16 (B) or rAd5, chAd3 or chAd63 (C). (D/E) The frequency of total CD8+ T cells that are 3+, 2+ or 1+ after vaccination with 1 × 10⁹ PU of rAd5, rAd28, rAd35, sAd11 or sAd16 (D) or rAd5, chAd3 or chAd63 (E). (F) The frequency of total CD8+ T cells that are 3+, 2+ or 1+ after vaccination with each dose of rAd5. (G) The proportion of Gag-specific CD8+ T cells that are 3+, 2+ or 1+ after vaccination with each dose of rAd5. For bar graphs, significant differences in frequency were assessed compared to rAd5 at 1 × 10⁹ PU, where * = p ≤ 0.05. Bars and error bars represent mean ± SEM. For pie graphs, significant differences in distribution were assessed compared to rAd5 at 1 × 10⁹ PU, where # = p ≤ 0.05. Each group is representative of at least two independent experiments.

