Figure 4.
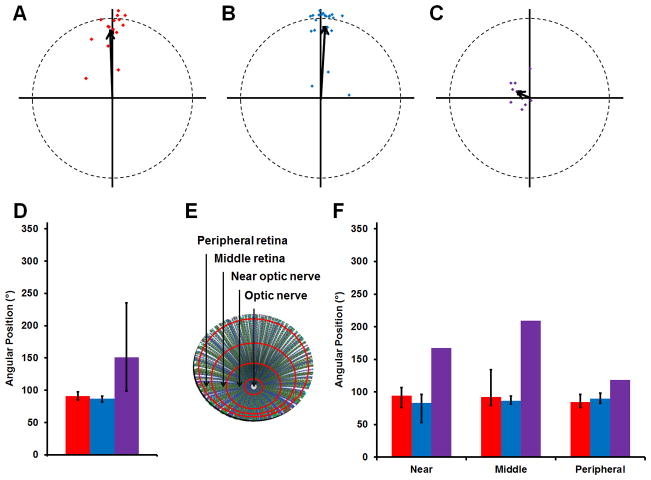
Basal body positioning is consistent throughout the adult retina. (A–C) The mean vectors from individual fields of red-/green-, blue-, or UV-sensitive cone are plotted (red, blue, or purple diamonds, respectively). The grand mean vectors are also plotted (black arrows). Optic nerve is up. (D) The grand mean angular position of basal bodies is plotted for each subtype of cones. (E) Schematic of a flat-mounted retina showing the different regions where fields of cells were analyzed. (F) The mean position of basal bodies is shown for each subtype of cones in regions of the retina near the optic nerve, in the middle of the retina, and in the peripheral retina. Red-/green-, blue-, and UV-sensitive cones are shown in red, blue, and purple, respectively. Error bars represent the confidence intervals that are calculated to 95% confidence. The lack of error bars for UV-sensitive cones indicates the strength of the trend was too weak to calculate a confidence interval. Magenta-green copies are available in the Journal’s supplemental data figures.

