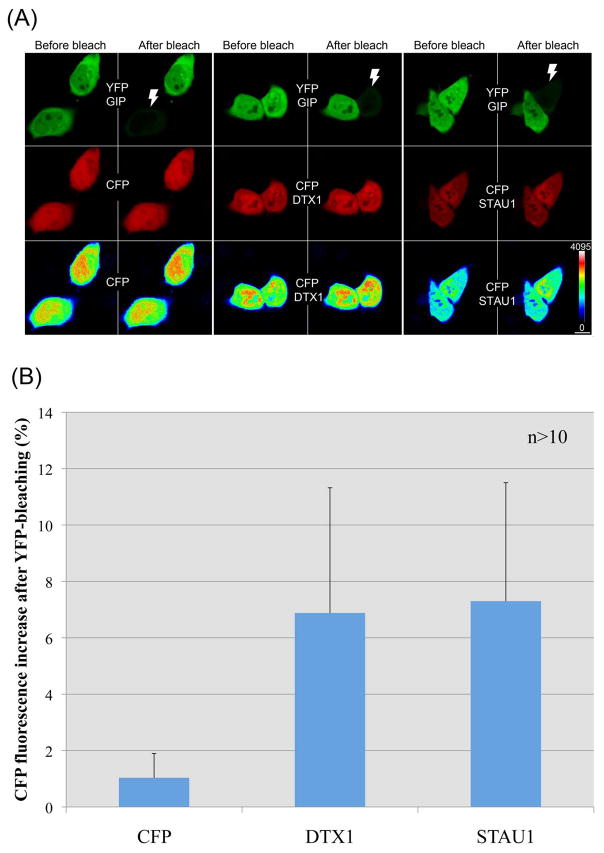
Fig. 3.
FRET between YFP-GIP and DTX1 or STAU1 CFP fusion proteins in human cells. HeLa cells were co-transfected with a plasmid expressing hGIP fused to YFP (GIP) and a second plasmid expressing CFP, or CFP fused to DTX1 or STAU1. (A) Pre-bleach and post-bleach images of YFP-GIP and CFP chimeras (or CFP only) are shown in the first and second row, respectively. YFP and CFP images are pseudo-colored green and red, respectively. Last row indicates intensity color coding of the CFP images. Note the post-bleach increase in the CFP intensity of CFP-DTX1 and CFP-STAU1. The intensity change in control sample (leftmost panels for each) was almost undetectable. White thunder icons in YFP images mark the bleached cells. Color coding scale and the scale bar (10μm) are shown at the lower right corner. (B) CFP intensity from cells was measured before and after bleaching and the increase in fluorescence in the bleached cells was plotted. More than 10 cells were scored from each line and results represent the mean values with standard deviations.

