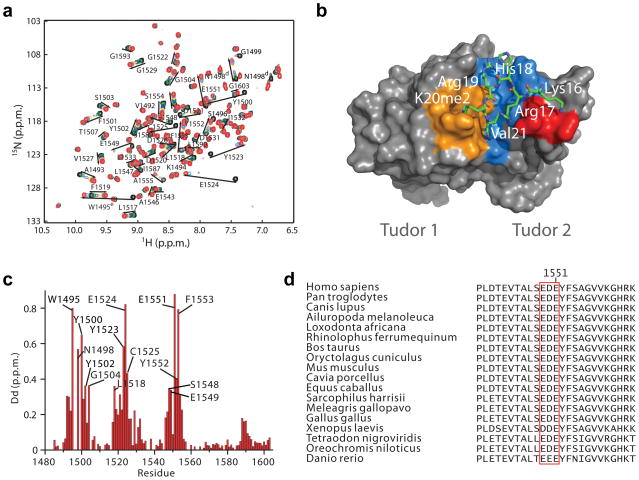
Figure 4. Solution structure of 53BP1-Tudor in association with a methylated H4 peptide.
(a) Changes in the 1H-15N HSQC correlation spectrum of 53BP1-Tudor upon addition of increasing amounts of H4K20me2 peptide. The 53BP1 correlation signals affected by the interaction with the peptide are labeled. (b) NMR structure of 53BP1-Tudor in complex with a histone H4K20me2 peptide. The peptide (aa 14-27) is in stick represention with only key interacting residues shown. 53BP1-Tudor is in gray surface representation with its methyllysine binding cage highlighted in orange. Important hydrophobic residues for which intermolecular NOEs were detected are shown in blue. The red area corresponds to 53BP1 Asp1550 and 2 Glu1551. (c) Histogram of 1H-15N chemical shift changes for the backbone amide atoms and Trp1495 HN and Asn1498 HN of 53BP1-Tudor observed upon saturation with the H4K20me2 peptide. The signals of Ser1496 and Gly1499 disappeared completely after titration with H4K20me2. Backbone HN signals of Trp1495, Ser1497 and Asn1498 were not detected, even in the absence of peptide. (d) Amino acid sequence alignment of 53BP1 from various vertebrate species illustrating conservation of the 1549–1551 acidic patch in the second Tudor domain.

