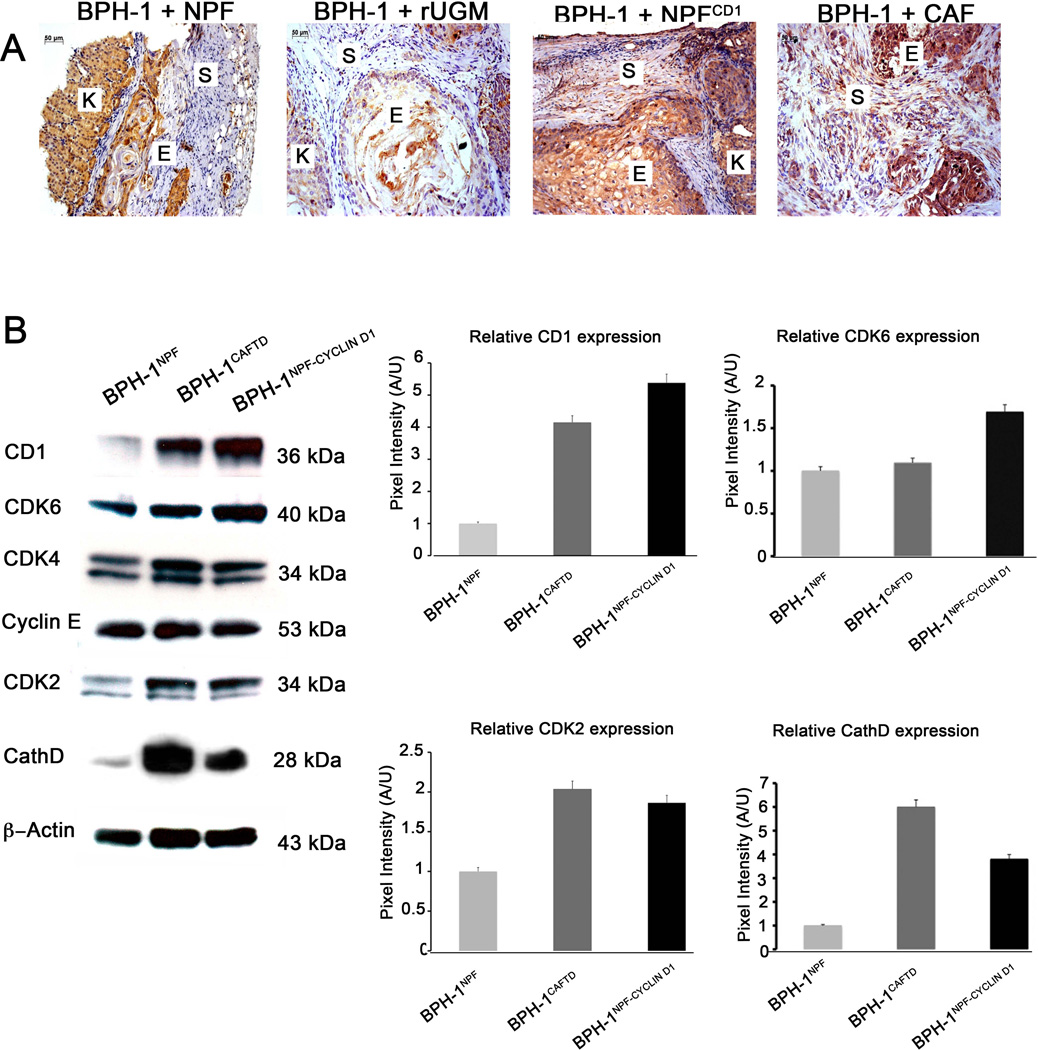
Figure 2. Evaluation of Cathepsin D as a paracrine mediator of neoplastic epithelial cell growth in tissue recombinants in vivo.
(A) Immunohistochemical analysis of CathD expression in recombinations of 1) BPH-1 + NPF, 2) BPH-1 + rUGM, 3) BPH-1 + NPFCD1, 4) BPH-1 + CAF. Scale bar is equal to 50µm (Letters K,S,E, refer to kidney, stroma, and epithelium). (B) Evaluation of densitometric analysis of cell cycle regulators and CathD in BPH-1NPF, BPH-1CAFTD1, BPH-1NPFCD1 cells. Expression of Beta-actin was used for a loading control. Graphical representation of the mean ± SD of band intensities.

