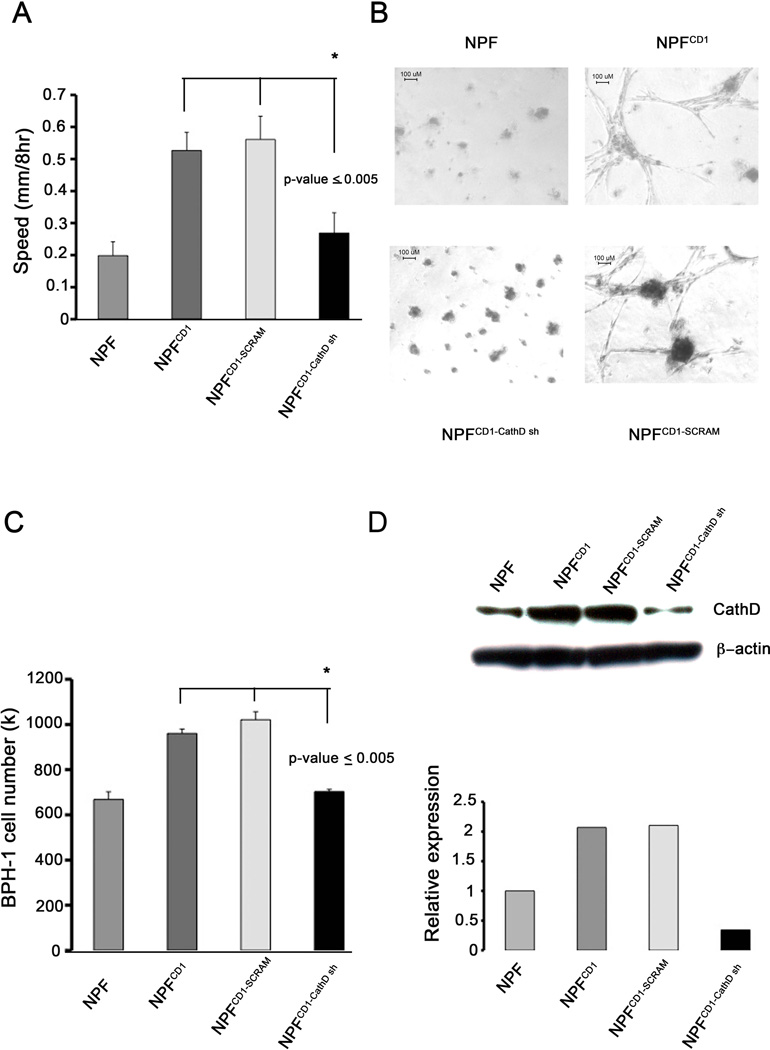
Figure 3. Cathepsin D is a critical mediator between BPH-1 cells and NPFCD1 in vitro.
(A) Wound healing assay. Confluent monolayers of NPF, NPFCD1, NPFCD1-control, NPFCD1-CathD sh were scratched with a pipette tip. Bar graphs represent the mean ± SD of rate of wound closure over 8 hour period. Significance determined by ANOVA, p-value ≤ 0.005 n=3. (B) 3D outgrowth assays. NPF cell lines were embedded in matrigel and cultured for 14 days, scale bar = 100µm. Images taken at 10x (3B, b). (C) Evaluation of CathD as a paracrine mediator of growth. BPH-1 cells were treated with conditioned media collected from NPF cell lines for 3 days. Cell numbers were quantitated by direct counting, graphical representation of the mean ± SD of the experiment is shown, significance determined by ANOVA p-value ≤ 0.005 n=3. (D) Western blot confirming knockdown of CathD in NPF, NPFCD1, NPFCD1-control, NPFCD1-CathD sh cells (Top). Densitometric analysis of band intensities performed to determine knockdown efficiency (Bottom).

