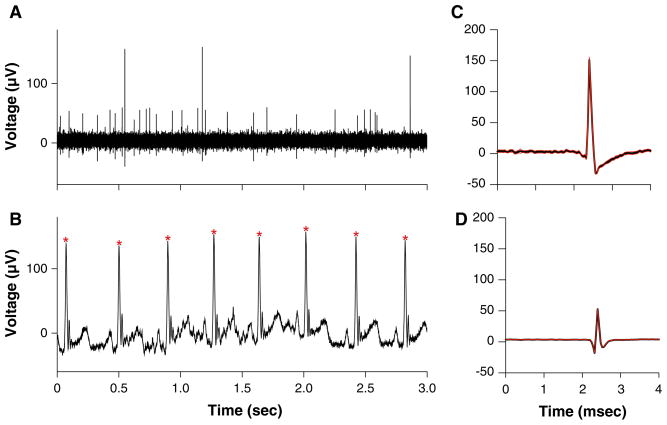
Fig. 1.
Example of data collected during experiments. a Activity recorded from the LTF using a microelectrode and sampled at 25,000 Hz. b Electrocardiogram, which was full-wave rectified and sampled at 1,000 Hz. Asterisks designate R-waves. c, d Average waveforms for two units that were isolated using spike sorting from the recording partially depicted in a (black lines), along with one standard deviation (red lines). c is the average of 38 waveforms, while d is the average of 878 waveforms

