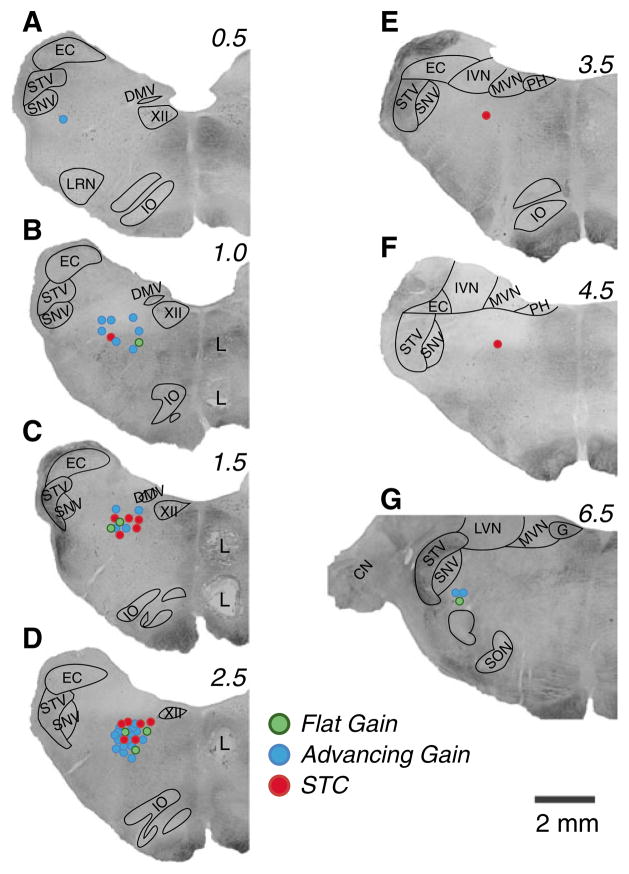
Fig. 2.
Locations of units in the LTF that responded to vertical vestibular stimulation. Locations are plotted on montages of micrographs of histological sections from one of the animals; numbers above each montage designate distance in millimeters rostral to the obex. Different color symbols indicate whether units had STC behavior (red circles) or response gains that increased more (advancing gain, blue circles) or less (flat gain, green circles) than fivefold per stimulus decade. Lesions (L) placed 2 mm apart in one track to permit reconstruction of unit locations are evident. CN cochlear nucleus, DMV dorsal motor nucleus of the vagus, EC external cuneate, G genu of the facial nerve, IO inferior olivary nucleus, IVN inferior vestibular nucleus, LRN lateral reticular nucleus, LVN lateral vestibular nucleus, MVN medial vestibular nucleus, PH prepositus hypoglossi, SNV spinal trigeminal nucleus, SON superior olivary nucleus, STV spinal trigeminal tract, XII hypoglossal nucleus

