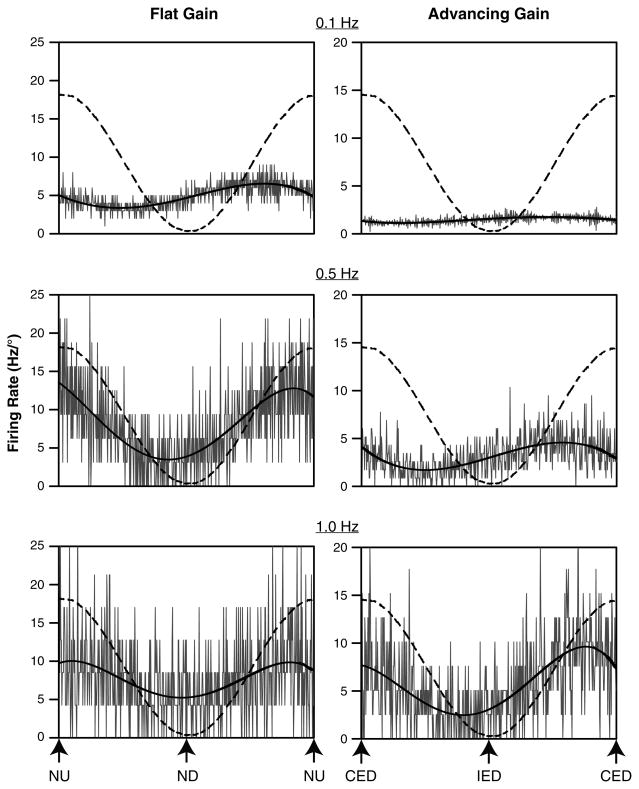
Fig. 5.
Averaged responses of two neurons to sinusoidal tilts at frequencies of 0.1–1 Hz. The stimulus amplitudes were 10° at 0.1 Hz, 5° at 0.5 Hz, and 2.5° at 1 Hz. Because smaller tilt amplitudes were used for higher-frequency rotations, firing rate is expressed in Hz/° to facilitate comparisons. In each panel, a dashed line shows tilt table position, and a dark line is a sine wave fit to the response. The response vector orientation for the unit whose data are provided in the left column was near the pitch plane, and the response gain increased approximately threefold as the stimulus frequency advanced from 0.1 to 1.0 Hz. The response vector orientation for the unit whose data are shown on the right was near the roll plane, and the response gain increased approximately sevenfold as the stimulus frequency advanced from 0.1 to 1.0 Hz. CED contralateral ear-down roll, IED ipsilateral ear-down roll, ND nose-down pitch, NU nose-up pitch

