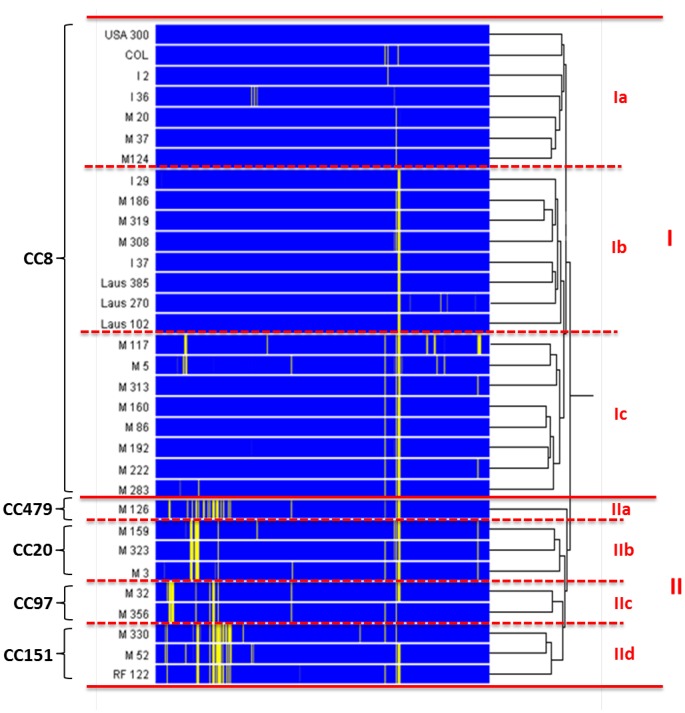
Figure 1. Clustering analysis, using Spearman correlation, of patterns of genome hybridization to probes matching 2,609 genes carried by the chromosome of strain USA300.
Each probe set (i.e. collection of all probes hybridizing to USA300 genes) is represented by a single row of colored boxes. The blue areas correspond to genes showing significant fluorescent signal (i.e present in a corresponding genome), whereas yellow bars indicate genes poorly or not fluorescent (i.e. absent from a corresponding genome). The dendrogram on the right of the figure (black lines) represents the similarity matrix of the strain set. Clonal clusters (CCs) are indicated on the left. Clusters and sub-clusters are indicated by roman letters on the right.

