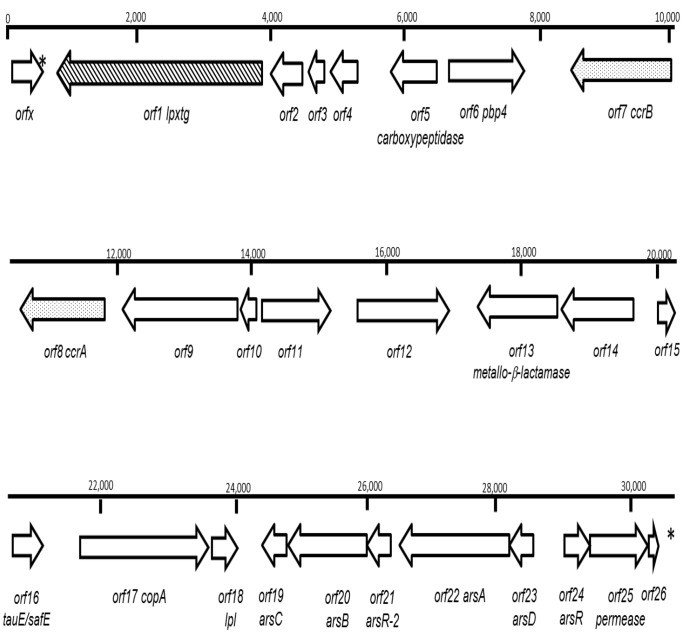
Figure 2. Schematic map of SCCM186.
Genes are represented by black arrows pointing in the direction of transcription. The positions of attL and attR flanking the cassette are indicated by asterisks. The gene coding for the potential new LPXTG (orf1) is represented by an oblique dashed arrow. CcrB (orf7) and ccrA (orf8) are represented by dotted arrows.

