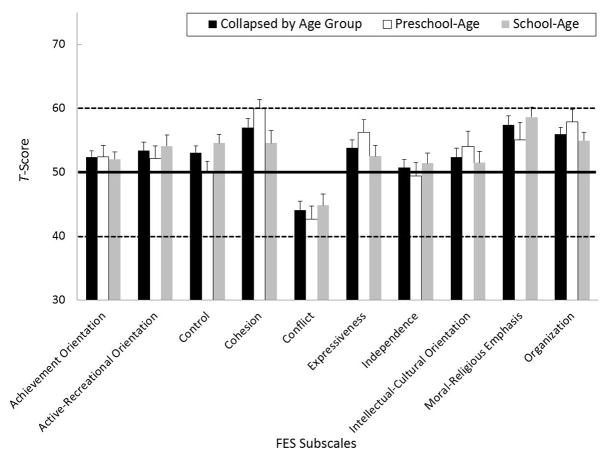
Figure 1.
Mean T-Scores (+1 SE) for the preschool-age children with cochlear implants (unfilled bars) and the school-age children with cochlear implants (gray-filled bars) on each of the FES subscales. The black bars display data for the children collapsed by age group. The normative mean and +/− 1 standard deviation (obtained from 1432 children with normal hearing24) are indicated by the dark solid and dashed lines, respectively.

