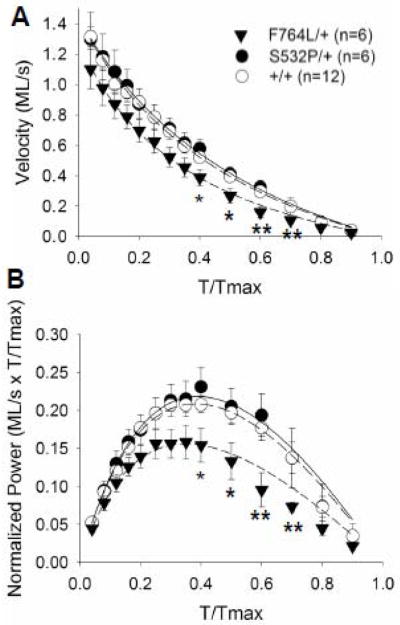
Figure 2.

Velocity- and power-tension relationships. A. Shortening velocity in the F764L/+ myocardial strips was significantly lower at several loads compared to +/+, while maximum velocity near unloaded conditions was similar between F764L/+ and +/+. There were no differences between S532P/+ and +/+. B. Power normalized to maximum isometric tension was also significantly lower in F764L/+ at specific loads, but was similar between S532P/+ and controls. Curves represent fit of Equation 1 to mean values. *P<0.05, **P<0.01 compared to +/+ controls by S-N-K. n = number of hearts, two strips per heart.
