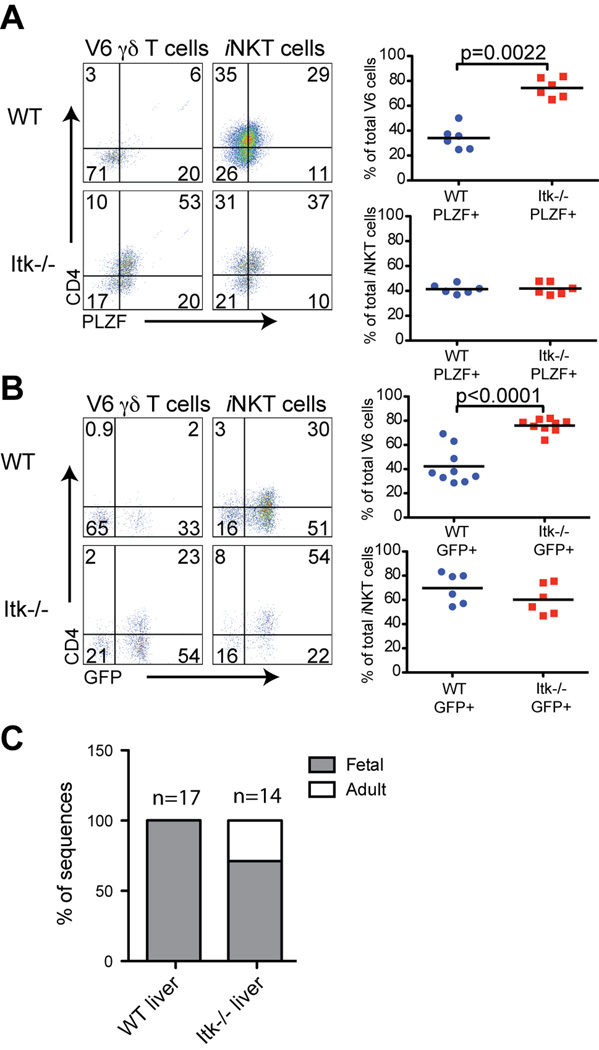
Figure 2. γδ NKT cells in the livers of Itk−/− have increased PLZF and IL-4 mRNA expression.
Lymphocytes were isolated from livers of WT and Itk−/− mice or WT-4Get and Itk−/−-4Get mice and were analyzed by flow cytometry.
(A) WT and Itk−/− HSA− V6 γδ T cells and iNKT cells were examined for CD4 versus PLZF expression. Dot-plots show representative data, and the graphs show a compilation of data from all experiments. Statistically significant differences are shown with p values.
(B) WT-4Get and Itk−/−-4Get HSA− V6 γδ T cells and iNKT cells were analyzed for expression of CD4 and GFP. Dot-plots show representative data, and the graphs show compilations of data from all experiments. Statistically significant differences are shown with p values.
(C) Sorted V6 γδ T cells from WT and Itk−/− livers were analyzed for in-frame sequences of Vδ6 and Jδ1 junctions. The graph indicates the percentage of sequences corresponding to fetal-derived rearrangements or adult-derived rearrangements. The total number of sequences included in the analysis is indicated above each bar. Actual sequences are shown in Figure S1.

