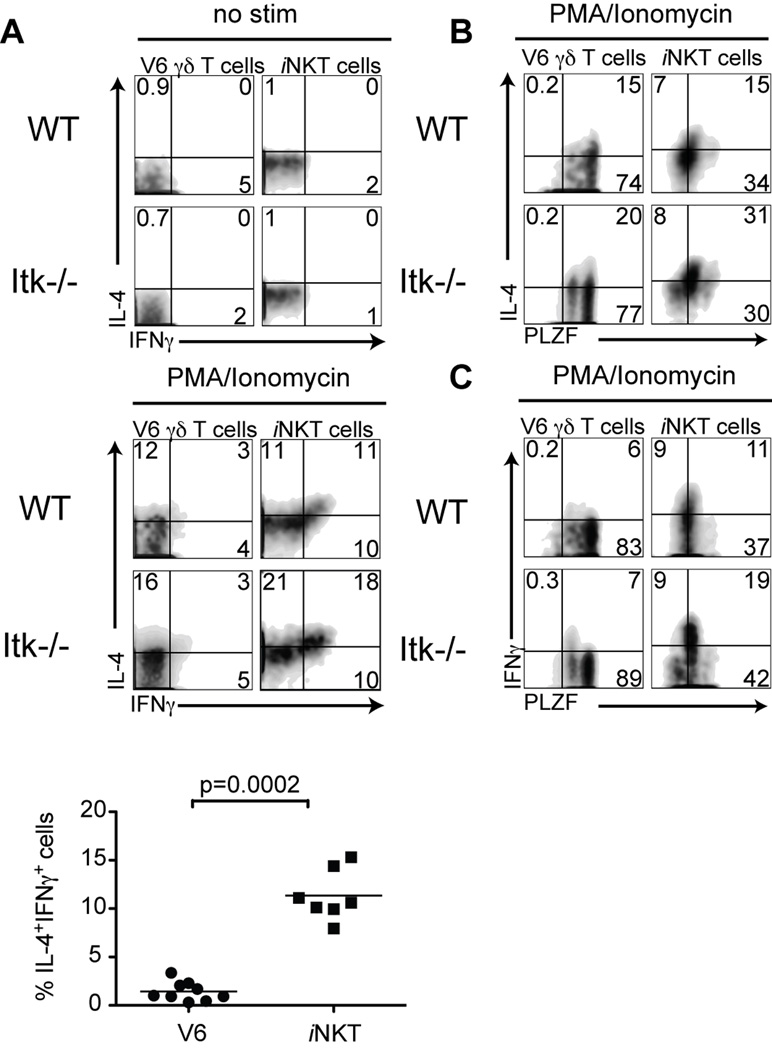
Figure 4. Levels of PLZF expression correlate with IFNγ production by γδ NKT cells.
Thymocytes from WT or Itk−/− mice were stimulated with10ng/ml PMA and 2 µg/ml Ionomycin for 5 hours, and then stained for intracellular IL-4, IFNγ and PLZF. Dot-plots show gated HSA− V6 thymocytes or CD1d tetramer positive cells.
(A) Non-stimulated (top) and stimulated (middle) cells were analyzed for IFNγ versus IL-4 production. The graph (bottom) shows a compilation of data indicating the percentage of double IL-4+ IFNγ+-producing cells among WT V6 compared to iNKT cells. Statistical significance is shown with p value.
(B, C) Stimulated cells were analyzed for IL-4 versus PLZF expression (B) or IFNγ versus PLZF expression (C).

