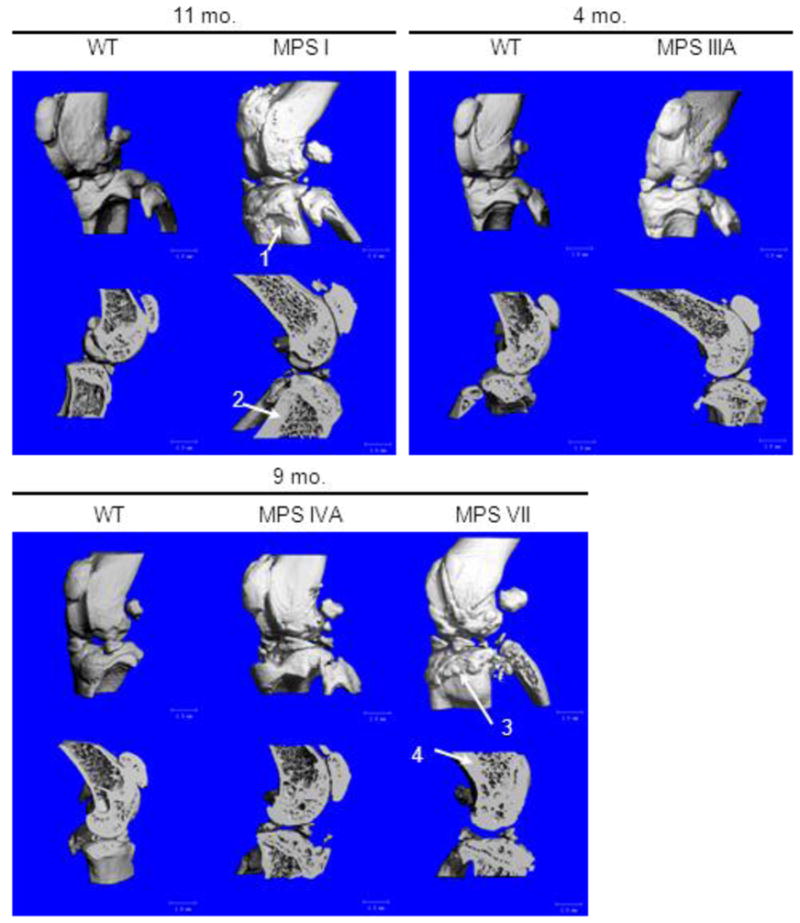
Figure 4.

Three dimensional micro-CT reconstructions of knee joints in MPS I, IIIA, IVA, and VII mice. Cross-sections are sagittal through the midline of the knee joint. Arrow 1 shows abnormal periosteal bone formation on the tibia of an MPS I mouse. Arrow 2 shows an area of increased bone thickness in an MPS I mouse compared to the WT control mouse. Arrow 3 shows severe abnormal periosteal bone formation on the tibia of an MPS VII mouse. Arrow 4 shows abnormally thickened bone in an MPS VII mouse compared with the bone thickness in an age-matched WT mouse.
