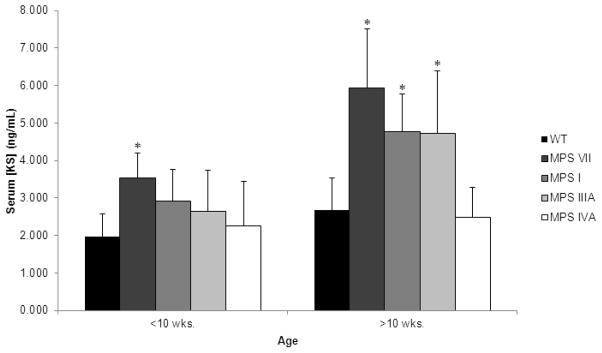
Figure 8.

Mouse serum concentration of KS. Error bars are +/− 1 SD. P-value of less than 0.05 compared with serum KS level in age-matched WT mice is represented with an asterisk. Sample sizes are as follows: Less than 10 weeks of age: WT, n=15; MPS VII, n=5; MPS I, n=2; MPS IIIA, n=7; MPS IVA, n=5. Greater than 10 weeks of age: WT, n=24; MPS VII, n=9; MPS I, n=9; MPS IIIA, n=3; MPS IVA, n=12.
