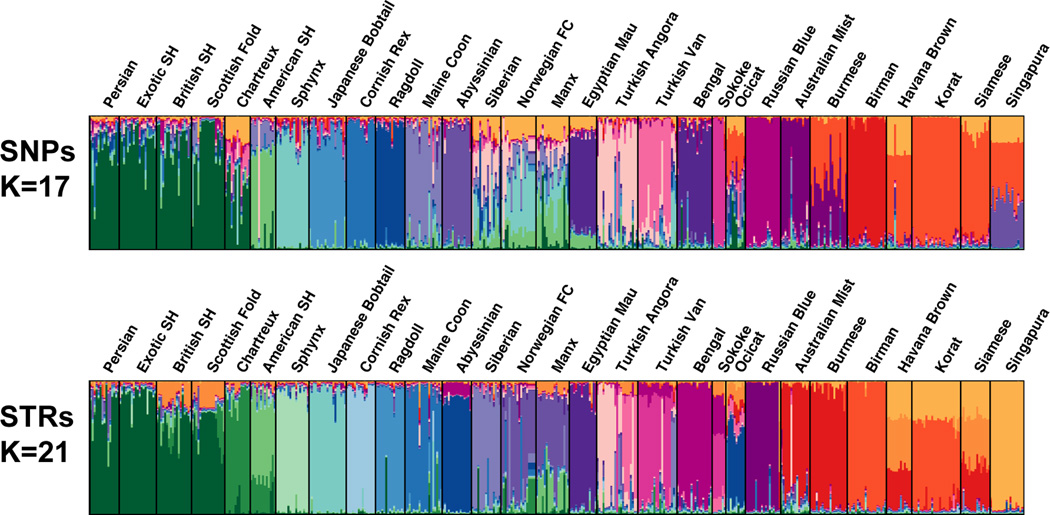
Figure 1.
Bayesian clustering of cat breeds. Clustering of breeds at K=17 and K=21 as calculated with SNPs and STRs respectively. Each column represents an individual cat. The y-axis represents Q, or the proportional estimate of genetic membership to the given cluster (K). Each K cluster is indicated by a unique color.

