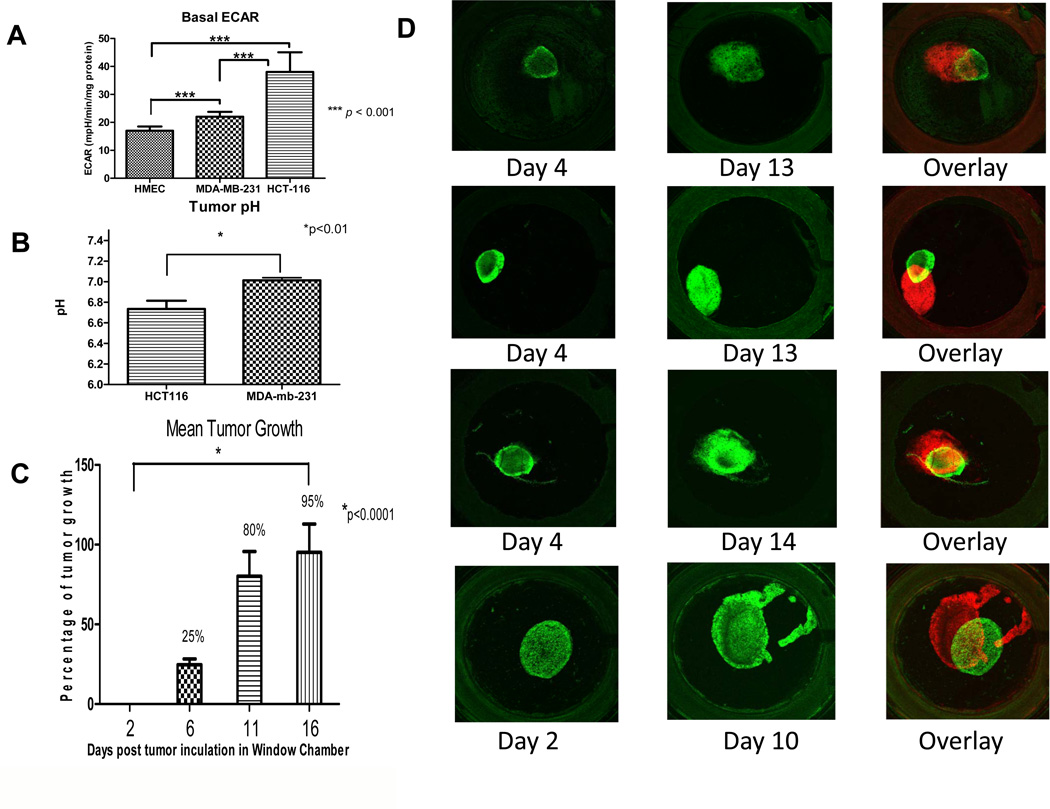
Figure 1. Proton production, pHe and tumor growth.
(A) In vitro extracellular acidification rate, ECAR, of tumor cells vs. normal cells. The rate of proton production was determined over a 30 minute time period using Seahorse XF-96 Instrument designed to measure in vitro metabolic rates. We show a significant increase in H+ production especially in our colon cancer cell line HCT116 when compared to human normal mammary epithelial cells HMEC (*P<0.001). (B) In vivo pH tumor measurements. Tumor pH measurements were obtained by electrode. The average pH of the tumors for each cell line are shown, with a significantly (*P<0.01) lower pHe in the HCT116, compared to MDA-mb-231, tumors. (C) Mean growth of HCT116/GFP tumors within the dorsal window chamber. Tumor area was measured at days 2, 6, 11 and 16 by fluorescent pixel number. Data are expressed as percent increase by the ratio of area at given day to that of day 2 and subtracting 100 for normalization. Thus, a 100 percent increase represents a doubling of area. The mean growth illustrated a significant increase in size of the tumor over 2 weeks (p<0.0001). (D) Intravital microscopy images of in vivo tumor growth in the dorsal window chamber. The images were captured with a 1.25X lens on days 2 or 4 and 10, 13 or 14. These longitudinal images were pseudo-colored green (early) or red (late) in order to superimpose the images and observe magnitude and direction of tumor growth.

