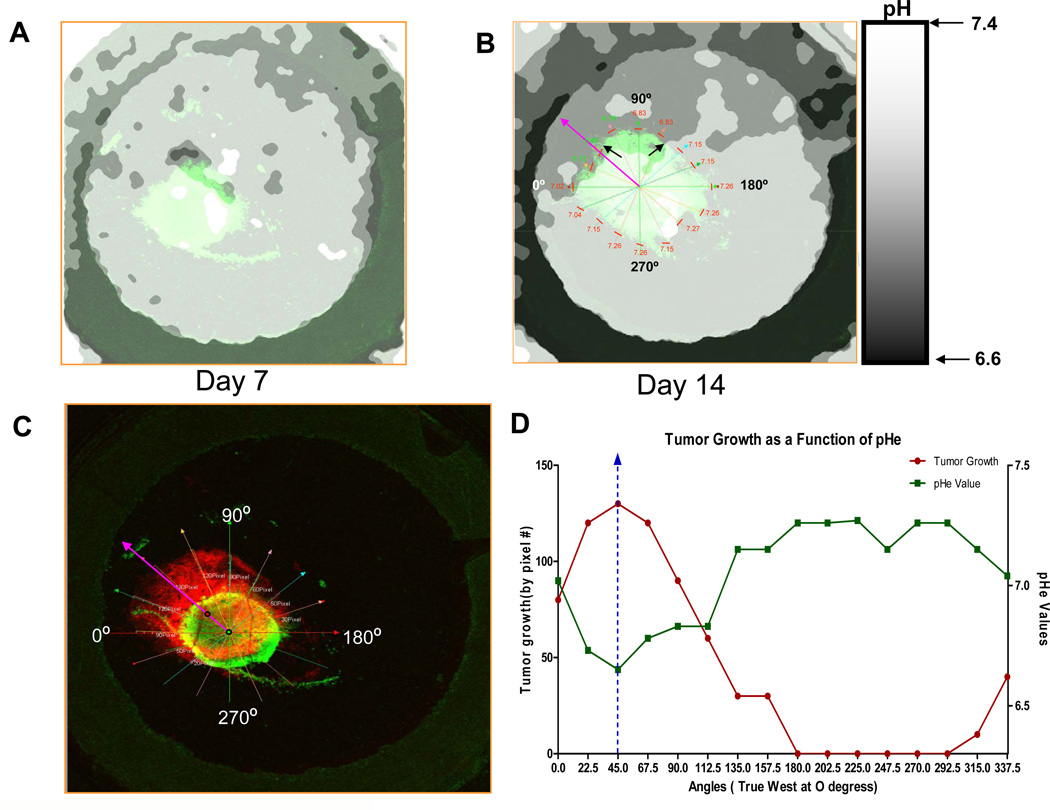
Figure 2. Intravital and ratiometric images of the extracellular pH with SNARF-1.
Data are shown for one tumor, which was representative of four control tumors. The extracellular pH (pHe) of HCT116-GFP tumors were measured using SNARF-1 Free Acid at (A) day 7 and (B) day 14. 200µl of 1mmol/L of SNARF solution was injected into the mice via tail vein injection. Images were captured using a 1.25X lens, 50 minutes post SNARF-1 injection. The pHe was measured and ratiometric images were converted to a pH image using calibration data as per Material and Methods. Black arrows are indicating the acidic environment towards which the tumor is growing. In figure (B), the day 14 ratiometric image was co-registered with its corresponding fluorescence image. The pHe was then measured 100microns from the tumor edge (represented by the short red lines). pHe measurements were taken every 22.5 degrees of arc and are located above red lines. Purple arrow indicates the region of strongest acidity and direction of tumor growth. (C) Tumor at day 14 was pseudo-colored red in order to superimpose the tumor image on Day 4 (green) and measure tumor growth from tumor edge on Day 4 to tumor edge on Day 14. Radial lines designate angles and tumor growth was measured by pixels. (D) Tumor growth and pHe plotted as a function of angle.

